

Summary
- Fear came early in 2025, but markets moved faster than headlines. Tariff shocks and recession worries triggered a sharp selloff (almost 19%), yet resilient economic growth and shifting policy kept the economy and stock market on steadier footing than many expected. Poor timing proved far more costly than bad news.
- US stocks delivered strong returns despite starting the year at expensive valuations. Earnings growth, not higher multiples, did most of the heavy lifting, with gains broadening beyond a small group of AI leaders. Valuations remain a risk in the US, but fundamentals helped justify them.
- The dollar weakened, and international markets finally had their moment in the sun. A softer dollar helped, but strong earnings growth and animal spirits drove the largest non-US equity outperformance in more than a decade, reminding investors that market leadership can rotate after all.
- Bonds surprised almost everyone. Despite inflation fears and deficit concerns, yields fell broadly across most maturities, delivering the best year for the US investment grade bond market since 2020 and rewarding investors who stayed diversified instead of abandoning fixed income.
- The biggest lesson of 2025 was about behavior. Good outcomes came from staying invested, remaining diversified, and resisting the urge to overreact when narratives shifted. Success in the markets requires a long-term view; keeping that in mind is a sound way to begin the new year.
The story investors told themselves at the start of 2025 turned out to be very different from the one the market actually wrote. Even so, the events of 2025 still offer some valuable insights and lessons for investors. Let’s dive in.
1) The US Stock Market’s Journey
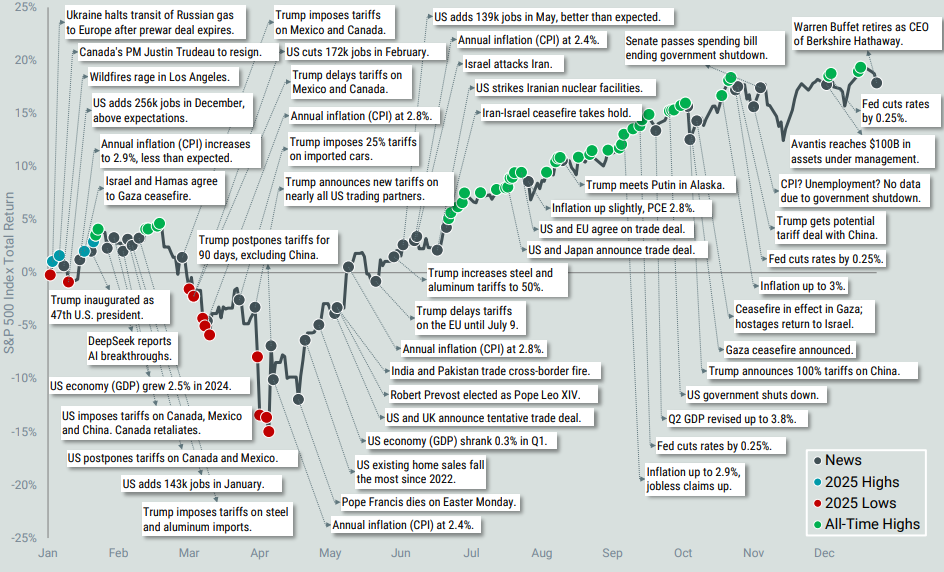
Source: Avantis Investors. Data from 1/1/2025 – 12/31/2025. Past performance is no guarantee of future results.
Markets rarely move in straight lines, and they almost never reward consensus thinking. At the start of 2025, uncertainty was back. Economic forecasters warned of a coming slowdown, and investors braced for rougher terrain ahead. Then came the tariffs. President Donald Trump unveiled a sweeping list of proposed duties that were far larger than expected, which injected a fresh dose of anxiety into already jittery markets.
By early April, fear took over and anxiety cascaded into action. US stocks fell more than 10% in just two days. The logic behind the panic was straightforward: tariffs would raise costs, squeeze consumers, dampen demand, slow economic growth, and provoke retaliation abroad.
Ultimately, the actual economic outcomes proved more complex than these initial fears suggested. Despite the early panic, both economic growth and consumer spending remained surprisingly resilient throughout the year. Although unemployment rose to a four-year high, the broader economy avoided the slowdown many had foreseen, and frequent and rapid changes in tariff policy limited the short-term economic damage.
The cost of poor timing in 2025 was substantial. Following the April 9 announcement of a 90-day tariff pause, the S&P 500 rose more than 9% in a single day. Missing that day alone materially reduced returns. This outcome reminds us that markets respond to expectations rather than headlines. It reinforces the idea that overreacting to macro events is rarely a winning strategy. Even if you correctly predict an event, you still face the far more difficult task of predicting how markets will interpret and reprice it.
2) Equity Returns Explained
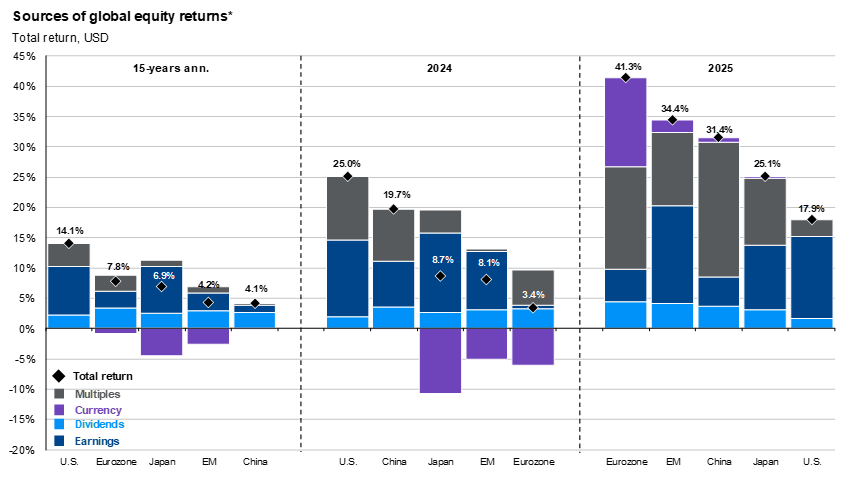
Source: J.P. Morgan Asset Management. Data as of 12/31/2025. 15-years ann. is a rolling 15-year period ending with the previous month-end. All return values are MSCI Gross Index data, except the U.S., which is the S&P 500. *Multiple expansion is based on the forward P/E ratio, and EPS growth outlook is based on next 12 months earnings estimates. Chart is for illustrative purposes only. Past performance is no guarantee of future results.
By most traditional yardsticks, US stocks were expensive heading into 2025. Valuations sat well above historical norms. The Shiller CAPE ratio, which is based on average inflation-adjusted earnings over a trailing 10-year period, hovered near 37, more than double its long-term average, and forward price-to-earnings ratios were already stretched. History suggested caution.
The market had other plans, though. Aside from a few brief stumbles tied to tariff and geopolitical headlines, US stocks climbed steadily and finished the year with a total return of nearly 18%. If higher prices weren’t the fuel, something else had to be. That something was earnings. Corporate profits grew, led by a handful of dominant companies tied to artificial intelligence, but the strength wasn’t confined to just the top names. Gains spread more broadly across the market, a notable shift from 2024, when rising prices owed more to enthusiasm than to improving fundamentals.
Moving forward, elevated valuations in the US remain a source of risk, particularly if earnings fail to meet expectations. Still, the composition of the US market matters. American companies exhibit higher returns on assets and equity than many global peers, which can justify higher multiples. In addition, consensus earnings growth estimates for 2026 and 2027 remain in the double digits, according to Bloomberg. If productivity gains from AI help sustain margins, the market could support higher valuations for longer than traditional models might suggest.
3) Dollar Hiccup
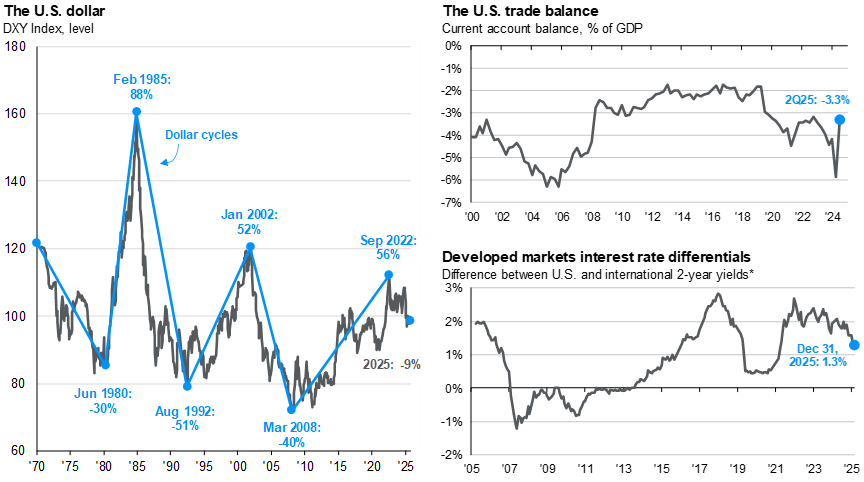
Source: Bloomberg; J.P. Morgan Asset Management. Data as of 12/31/2025.
The US dollar experienced a prolonged period of strength from 2011 through late 2022. Over that time period, the strength in the dollar was supported by relatively faster US economic growth, its role as a safe haven during periods of geopolitical stress, and higher interest rates compared with other developed markets.
Things changed in 2025, and a wave of tariff-related policy uncertainty sparked a sharp selloff following Liberation Day. The pressure didn’t stop there. Growing unease over the federal deficit and questions about the long-term stability of the U.S. financial system further weighed on demand. By year’s end, the dollar had fallen about 9% against a broad basket of foreign currencies.
That decline reignited the flame of dollar doomsayers. Their argument is straightforward: rising debt, widening deficits, and fading trust will undermine the dollar’s global role moving ahead. This all sounds reasonable. Except it hasn’t happened, and the evidence so far points in the other direction.
Indicators that reflect how the dollar is actually used in the world economy, from cross-border lending and debt issuance to FX trading, reserve holdings, trade invoicing, and SWIFT payments, look largely unchanged from 2022.1 If the dollar continues to weaken, though, foreign assets held in USD may benefit and US policymakers may face the harder choices sooner rather than later.
4) International Stock Dominance
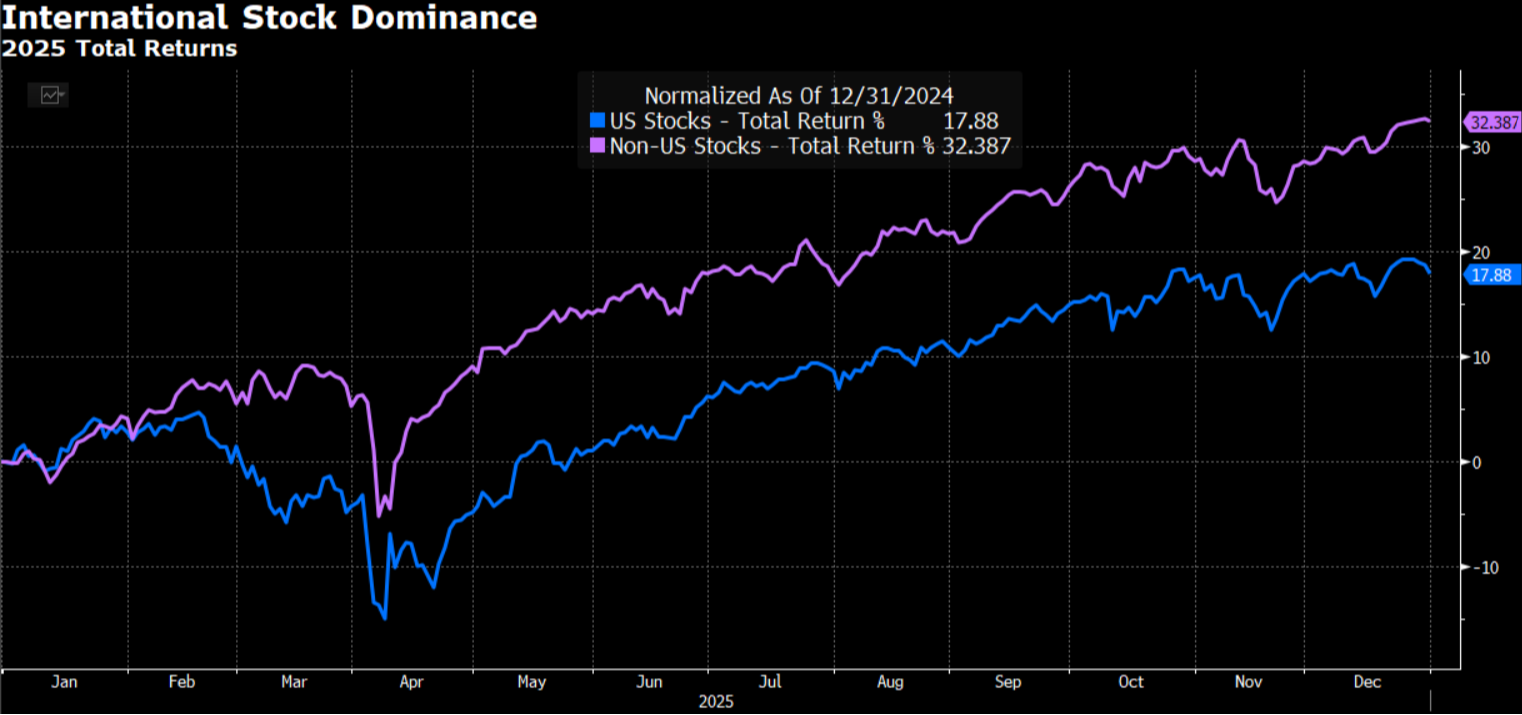
Source: Bloomberg. Data from 1/1/2025 - 12/31/2025. Non-US Stocks represented by the MSCI ACWI ex USA NR Index. US Stocks represented by the S&P 500 Index.
From 2009 to 2024, US equities dramatically outperformed international markets. Over that period, the S&P 500 Index generated approximately 3.6 times the return of the MSCI World ex-US Index. This extended run led many to concentrate heavily in US stocks.
In 2025, that trend reversed. The US market underperformed most global equity markets, and the degree of international outperformance was unusually large. The MSCI ACWI ex USA Index exceeded the return of the S&P 500 by roughly 14.5%, the widest margin in the past 15 years. The next largest gap occurred in 2017 and was only slightly above 5%.
A declining dollar aids the returns of non-US market exposure held in USD, but the data indicates that it didn’t explain all outperformance from non-US markets during the year. In fact, solid earnings growth and multiple expansion were drivers of impressive returns. And unlike the US, international markets still trade at significantly lower multiples, offering the opportunity for further multiple expansion to drive returns in the future. The results in 2025 are a welcome reminder of the potential value of globally diversified portfolios.
5) Fixed Income Powerup
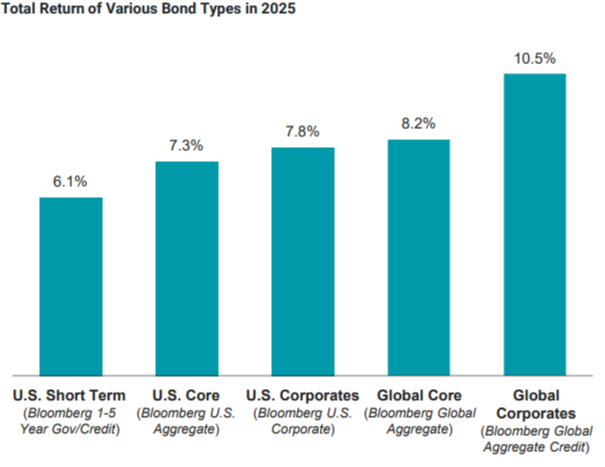
Source: Avantis Investors. Data from 1/1/2025 - 12/31/2025. Past performance is no guarantee of future results.
There was a plethora of reasons to stay away from bonds at the start of 2025. A strong job market, stubborn inflation, and an administration focused on extending tax cuts. For many investors, the conclusion seemed obvious. Rising rates were inevitable, and bonds were something to avoid.
The market, however, had other ideas. Over the course of the year, interest rates fell across most maturities. Two-year Treasury yields dropped from 4.24% to 3.48%, while the 10-year yield declined to 4.17% from 4.48%. What looked like a hostile environment slowly turned into a favorable one.
Early in the year, inflation appeared stuck, and fears ran high that aggressive tariffs would push prices even higher. But reality proved less severe. Actual tariff rates came in below initial threats, especially after concessions with key industries. At the same time, the labor market cooled noticeably in the second half of the year. Together, these shifts eased inflation pressure and cleared the path for rate cuts.
The result was a strong year for fixed income. The Bloomberg U.S. Aggregate Bond Index delivered its best return since 2020, gaining 7.3%. Short-term bonds held their own, but investors willing to take on modest credit risk were rewarded even more. Corporate bonds ultimately outperformed, returning 7.8% for the year.
6) Central Bank Rates
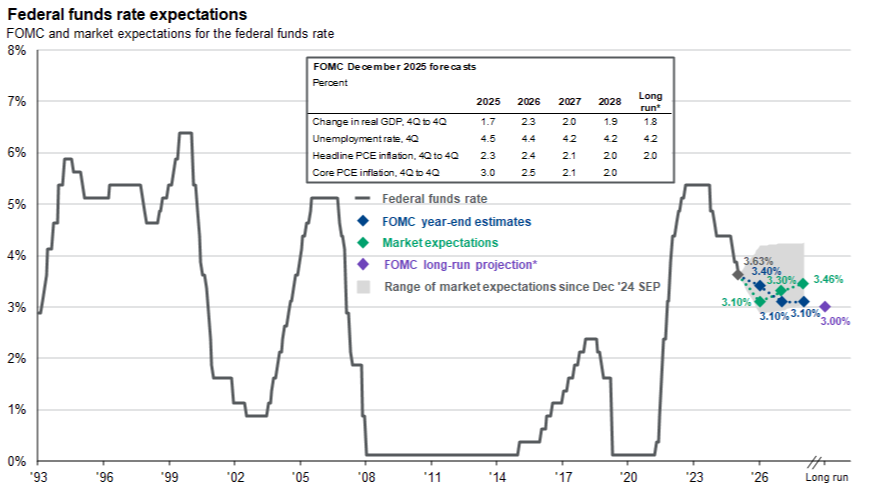
Source: J.P. Morgan Asset Management. Data as of 12/31/2025.
The Federal Reserve lowered interest rates twice during the fourth quarter, following a single cut in the prior quarter. These actions reduced the federal-funds target range to 3.50%–3.75%, down from 4.25%–4.50% at the beginning of 2025.
These interest rate cuts occurred amid unusually sharp disagreement among policymakers. Each decision included at least one dissenting vote, highlighting differing assessments of the economic outlook. Some officials supported further easing to respond to slowing labor market momentum and to reduce downside risk to growth. Others opposed additional cuts, citing persistent inflation that, while significantly lower than in 2022, remains above the Fed’s stated target.
Layered on top of that debate is leadership uncertainty. Markets are still waiting for the Trump administration to name Jerome Powell’s successor, with many expecting a chair more inclined toward easier policy. Even so, expectations remain measured. Analysts largely believe the Fed will pause at its first meeting of 2026, with futures markets assigning only modest odds to another cut.2
7) Gold vs. Bitcoin
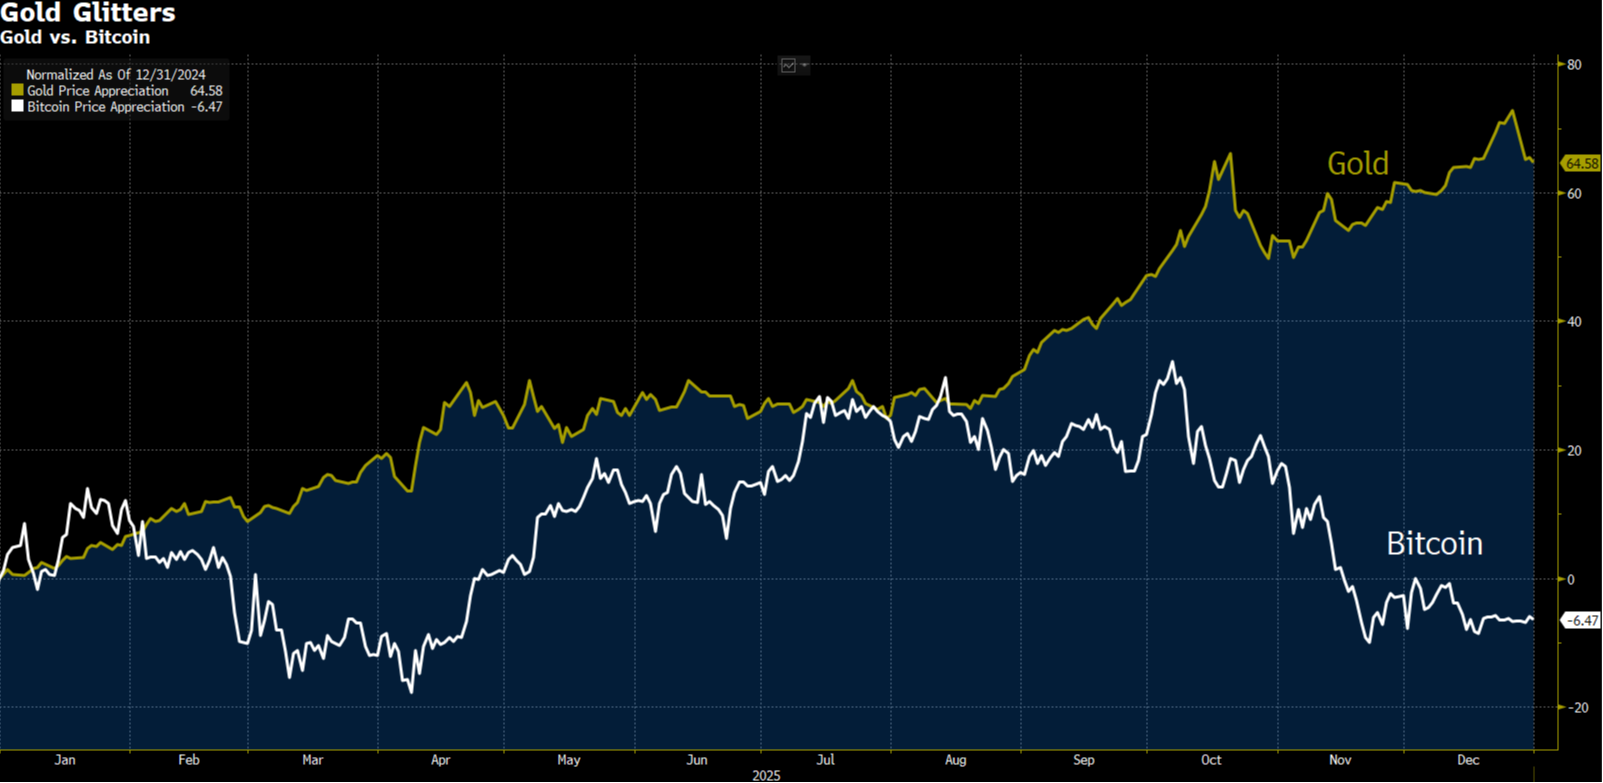
Source: Bloomberg. Data from 1/1/2025 - 12/31/2025.
Among all major asset classes, gold delivered the strongest performance, rising nearly 65% and ending the year at $4,319 an ounce. In a year marked by doubt, investors turned to something old, tangible, and familiar.
The rally was historic. Gold hadn’t posted a calendar-year gain like this since 1979, a period defined by geopolitical turmoil, runaway inflation, a weakening dollar, and speculative excess. Sound familiar?
While gold has seen a substantial run-up this year, its current elevation may imply greater downside risk for investors. Research by Campbell Harvey and Claude Erb shows that when gold trades at elevated levels after adjusting for inflation, future returns often disappoint.3 History offers clear examples. In 1980, soaring prices gave way to a long stretch of lackluster performance. A similar pattern followed gold’s inflation-adjusted peak in 2011, with prices falling sharply in the years that followed.
Not every asset marketed as a hedge passed the test in 2025. Bitcoin, often described as digital gold, struggled mightily. Despite the approval of spot ETFs and a strong rally in risk assets earlier in the year, confidence cracked in September. Selling fed on itself as leverage unwound, and Bitcoin ended the year down more than 6%, far below its previous high.4 Faced with geopolitical strain, rising deficits, and lingering inflation, investors made their preference quite clear.
8) Takeaways For the Year Ahead
2025 was a good year to be an investor. Stocks rose, bonds surprised to the upside, and alternatives had their turn in the spotlight. Although, there are plenty of unresolved questions still hanging in the air.
Inflation, interest rates, the Fed, and artificial intelligence will keep generating headlines. But the stories that end up mattering most are usually the ones no one is talking about yet. They always are.
The results of 2025 offer a quiet reminder. Good outcomes don’t require perfect foresight. They come from showing up, staying diversified, and resisting the urge to overreact when the narrative shifts. Markets reward patience more often than prediction, even in years when everything seems to work.
(1) Cembalest, Michael. "Eye on the Market Outlook 2026: Smothering Heights." P. Morgan Asset Management, 1 Jan. 2026, am.jpmorgan.com/us/en/asset-management/protected/institutional/insights/market-insights/eye-on-the-market/outlook-2026/.
(2) "CME FedWatch Tool." CME Group, 2026, cmegroup.com/markets/interest-rates/cme-fedwatch-tool.html. Accessed 8 Jan. 2026.
(3) Erb, Claude B., and Campbell R. Harvey. The Gold Dilemma. Working Paper no. 18706, National Bureau of Economic Research, Jan. 2013, www.nber.org/papers/w18706.
(4) Arnott, Amy. "8 Lessons for Investors from Market Turbulence in 2025." Morningstar Research, 2025. https://research.morningstar.com/articles/QU2CWXBZ2BFEXM3XE4H2QGEBXI/8-lessons-for-investors-from-market-turbulence-in-2025.
IMPORTANT DISCLAIMERS AND DISCLOSURES
This presentation is for educational and illustrative purposes only. It is not intended to offer or deliver investment advice in any way. Past performance is not indicative of future results. The information contained in this presentation has been gathered from sources we believe to be reliable, but we do not guarantee the accuracy or completeness of such information, and we assume no liability for damages resulting from or arising out of the use of such information. Any projections, market outlooks, or estimates are based upon certain assumptions and should not be construed as indicative of actual events that will occur. The performance numbers displayed herein may have been adversely or favorably impacted by events and economic conditions that will not prevail in the future. Any index presented does not incur management fees, transaction costs or other expenses associated with investable products. It is not possible to directly invest in an index.
Nova R Wealth, Inc. is a registered investment advisor with the U.S. Securities and Exchange Commission. SEC registration does not constitute an endorsement of the firm by the Commission, nor does it indicate that the adviser or investment adviser representative has attained a particular level of skill or ability. Nova R provides investment advisory and related services for clients nationally. This material is proprietary and may not be reproduced, transferred, or distributed in any form without prior written permission from Nova R Wealth, who reserves the right at any time and without notice to change, amend, or cease publication of the information contained herein.