

Summary
Defying Expectations: Despite severe negative developments for 2025, including escalating tariffs, a U.S. economic contraction, geopolitical conflict, and a sovereign downgrade, both U.S. and international stock markets generated positive returns in the first half of the year.
Bad Vibes: There’s a record-wide gap between consumer and business confidence (soft data) and actual economic performance (hard data). History suggests this disconnect doesn’t reliably predict downturns—people may feel worse than they’re acting.
International Dominance: After years of U.S. stock dominance, international equities significantly outperformed in the first half of 2025, largely benefiting from a weakening U.S. dollar, which boosted returns for U.S. investors in foreign assets.
Discipline Still Wins: When headlines are scary and uncertainty is high, the instinct is to act. But the market’s strength this year reminds us that staying invested and avoiding emotionally driven decisions remains a core principle of successful long-term investing.
“It’s tough to make predictions, especially about the future” – Yogi Berra
Imagine it's New Year's Day 2025. Someone hands you a note with a few spoilers from the future. It reads, "Listen. There will be escalating tariffs imposed by the U.S. on virtually every country around the world, reaching rates the highest they've been since the 1930s. The U.S. economy will contract in Q1, a 12-day military conflict between Israel and Iran will occur that escalates to scary levels, and oh, yeah, the U.S. will receive a sovereign downgrade due to exploding debt levels."
You would have been forgiven for assuming that equity markets around the globe would be deep in the red. And yet, the U.S. stock market, as represented by the S&P 500 Index, was up over 6% on a total return basis ending June 30th; international stocks, as represented by the MSCI ACWI ex USA NR Index, rose almost 18% ending June 30th; and the world’s reserve currency—the U.S. dollar—fell double digits from its year-to-date high.
There were some bumps and bruises along the way, though. Before President Trump announced the 90-day pause on tariffs, U.S. stocks fell almost 19% from their highs, only to recover after market participants decided that despite all of the geopolitical angst, maybe AI will still solve everything; maybe interest rates won’t ruin everyone’s fun; and maybe corporate profits are less sensitive to things like war and trade barriers than you’d think.
These optimistic assumptions are debatable, but for now, any news better than original expectations seems to boost sentiment and animal spirits, driving the market higher.
For a detailed look at the news and events of 2025, the chart below illustrates major headlines alongside the S&P 500 Index's cumulative return.
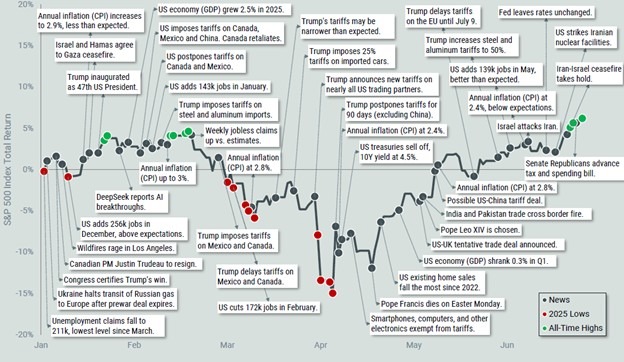
Source: Avantis Investors. Data from 1/1/2025 – 6/30/2025. Past performance is no guarantee of future results.
Disconnect on Data
One of the great economic mysteries of our time is the interesting disconnect between ‘hard’ and ‘soft’ economic data.
Hard economic data indicators include retail sales, payrolls, housing, and industrial production. In contrast, soft economic data indicators encompass consumer/business sentiment and risk appetite.
Currently, the gap between sentiment and "hard" economic data is the widest it has been since the pandemic. This suggests extreme negative sentiment despite official economic activity not showing signs of distress. There are lots of theories as to why this might be the case—including increased politicization of survey responses and declining response rates.
However, CreditSights analysts Zachary Griffiths and Brian Perez quantified this disconnect, identifying only about a dozen historical instances of such a large disparity. Past examples include the SVB collapse in March 2023, the COVID-19 pandemic in April/May 2020, and the period following the September 11th attacks in October 2001.
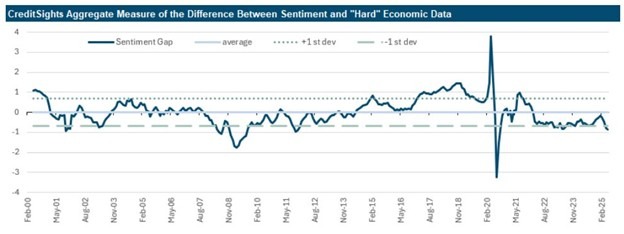
Source: CreditSights, Umich, Conference Board, ISM, FRED, Bloomberg.
The critical question, then, is whether this significant disparity helps forecast the future direction of the economy. According to CreditSights, it does not. Historical periods serve as their guide, suggesting that the recent worsening in economic sentiment may not necessarily result in a slowdown or outright downturn in economic activity.1
Given the increased frequency of this disparity, negative sentiment may be the new normal, with consumers acting differently than their survey responses suggest.
International Dominance
After a long stretch in which U.S. stocks consistently outperformed their international counterparts, the pattern has shifted—at least so far in 2025. The basic premise behind investing some money into U.S. stocks and some into international stocks is that sometimes our home market will outperform and underperform other times. This means if U.S. stocks underperform, then outperformance from other markets can improve overall returns of the portfolio.
Investing in uncorrelated assets—or assets that don’t move exactly alike—is a simple yet sound principle of investing. However, being an investor in the U.S. lately has created trust issues, especially when, for years, the U.S. stock market has delivered stronger returns than many other markets.
This year, at least for a short while, has been different. International stocks, as represented by the MSCI ACWI ex-USA Index, are up 17.90% year-to-date, while U.S. stocks, as represented by the S&P 500 Index, are up 6.20%. That is a relative outperformance of over 11.70%. Certainly nothing to snuff at.
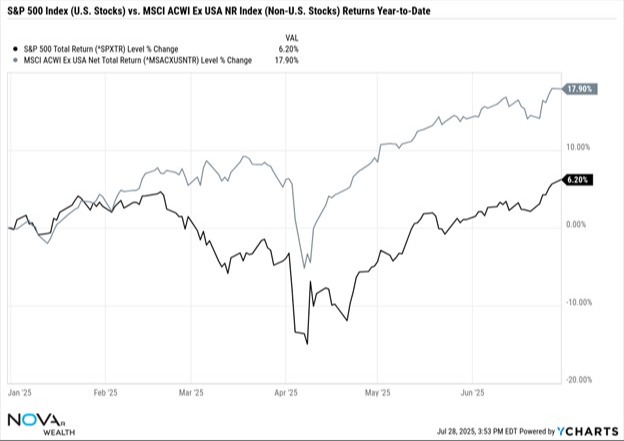
Source: YCharts; Nova R Wealth. Data from 12/31/2024 – 06/30/2025. Past performance is no guarantee of future results. See important disclosures at the end of this material.
A large contributor to the success of international investments this year is a declining U.S. dollar. From the perspective of a U.S. investor, your return comes from two sources if investing internationally:
1) How the foreign stock performs in its local currency
2) How that local currency moves relative to the U.S. dollar
Let’s walk through a quick example, since the math can get a little twisty.
You invest in a company based in Japan. Its stock is priced in yen (JPY). Let’s say one share costs 10,000 yen, and at the time of purchase, the exchange rate is 1 USD = 100 yen, so that costs you $100.
A few months later, the stock rises to 11,000 yen—that’s a 10% gain in Japanese yen. Meanwhile, let’s say the dollar weakens and now 1 USD = 90 yen. That means each yen is worth more in dollar terms.
Now you sell the stock. You convert your 11,000 yen back to dollars at the new exchange rate: (11,000 / 90 = $122.22).
You started with $100 and now you have $122.22—a 22.2% total return in USD. To summarize, you got a 10% return from the stock rising (in yen), and you got an additional boost from the yen getting stronger against the dollar. Together, they added up to a bigger return in USD.
While this is just one example, it illustrates how a weaker dollar can boost returns from international investments. Historically, periods of non-U.S. stock outperformance have often lined up with a declining dollar.
In the chart below, we show five-year rolling returns of U.S. stocks relative to international stocks, alongside the U.S. Dollar Index. Blue shaded areas reflect periods when U.S. stocks outperformed, while black areas highlight times when international markets led.
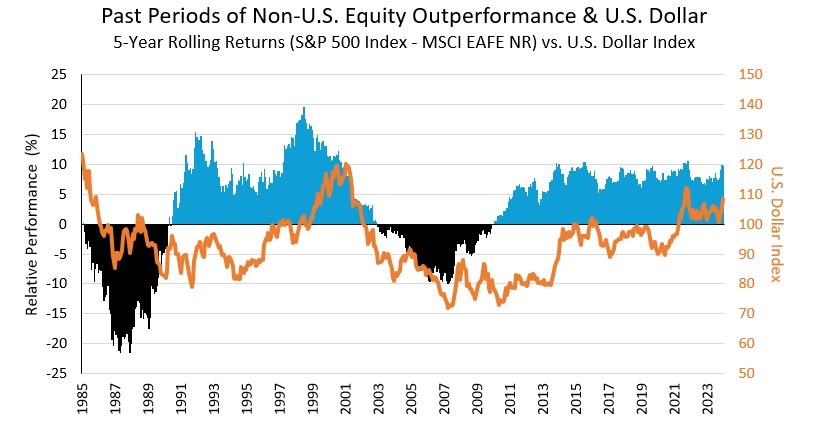
Source: Morningstar; Bloomberg; Nova R Wealth. Data from 12/31/1985 – 12/31/2024. U.S. stocks represented by the S&P 500 Index TR. Non-U.S. stocks represented by the MSCI EAFE NR Index. U.S. Dollar Index (DXY) from ICE. Past performance is no guarantee of future results.See important disclosures at the end of this material.
Of course, currency is just one factor. We don’t know where the dollar is headed next. But if it continues to weaken, it could provide a tailwind for non-U.S. stocks, and a globally diversified portfolio may stand to benefit.
Takeaways
If the first half of 2025 taught us anything, it’s that markets and headlines don’t always move in the same direction. Despite shrinking GDP, higher tariffs, geopolitical conflict, and policy drama, the S&P 500 rose more than 6%. It was one of the most volatile periods in recent memory, yet markets showed resilience.
And yet, there is still very little clarity. Global trade is in flux, the geopolitical landscape is shifting, and inflation and interest rates remain uncertain. In moments like these, it’s tempting to believe that a murky outlook must lead to murky returns. But as the first half has shown, that isn’t necessarily true.
First, we should remind ourselves that how we feel about the economy is not a reliable guide to how markets will behave. Investor sentiment often lags or overreacts, and trading on those feelings tends to hurt long-term outcomes.
Second, markets are forward-looking. They react not just to what’s happening, but to what might happen. Even bad news, once expected, gets priced in. When we think markets are ignoring the headlines, they’re usually actually already accounting for them.
Finally, the urge to act during volatile periods is powerful. But reacting emotionally to short-term noise often does more harm than good. Those who stayed disciplined and stuck to their plans were rewarded once again.
This environment is a reminder that your investment strategy needs to be built for uncertainty. Market stress is uncomfortable, but it is also normal. The best course is often to trust the process, stay diversified, and let time do the heavy lifting.
(1) Alloway, T., & Weisenthal, J. (2025, July 25). Maybe Vibes Just Don’t Matter for the Economy. Bloomberg: Odd Lots. https://www.bloomberg.com/news/newsletters/2025-07-25/maybe-vibes-just-don-t-matter-for-the-economy
The S&P 500 Index is widely regarded as the best single gauge of the U.S. equities market. The index includes a representative sample of 500 leading companies in leading industries of the U.S. economy. The S&P 500 Index focuses on the large-cap segment of the market; however, since it includes a significant portion of the total value of the market, it also represents the market.
The MSCI EAFE NR Index measures the performance of the large and mid cap segments of developed markets, excluding the US & Canada equity securities. It is free float-adjusted market-capitalization weighted.
The MSCI ACWI Ex USA NR Index measures the performance of the large and mid cap segments of the particular regions, excluding USA equity securities, including developed and emerging market. It is free float-adjusted market-capitalization weighted.
IMPORTANT DISCLAIMERS AND DISCLOSURES
This presentation is for educational and illustrative purposes only. It is not intended to offer or deliver investment advice in any way. Past performance is not indicative of future results. The information contained in this presentation has been gathered from sources we believe to be reliable, but we do not guarantee the accuracy or completeness of such information, and we assume no liability for damages resulting from or arising out of the use of such information. Any projections, market outlooks, or estimates are based upon certain assumptions and should not be construed as indicative of actual events that will occur. The performance numbers displayed herein may have been adversely or favorably impacted by events and economic conditions that will not prevail in the future. Any index presented does not incur management fees, transaction costs or other expenses associated with investable products. It is not possible to directly invest in an index.
Nova R Wealth, Inc. is a registered investment advisor with the U.S. Securities and Exchange Commission. SEC registration does not constitute an endorsement of the firm by the Commission, nor does it indicate that the adviser or investment adviser representative has attained a particular level of skill or ability. Nova R provides investment advisory and related services for clients nationally. This material is proprietary and may not be reproduced, transferred, or distributed in any form without prior written permission from Nova R Wealth, who reserves the right at any time and without notice to change, amend, or cease publication of the information contained herein.