

Summary
- AI isn’t dead, it’s rotating: Infrastructure names tied to chips, data centers, and compute continue to surge, while many SaaS (software as a service) firms and downstream application companies are being repriced as investors question long-term margins and competitive durability.
- International continues its dominance: Capital is moving beyond mega-cap U.S. growth into energy, materials, consumer staples, and emerging markets, where earnings revisions are improving and valuations remain meaningfully lower.
- Tariff drama revisited: The Supreme Court struck down the administration’s emergency-power tariffs, forcing a shift in strategy, but not a retreat from trade pressure. A new 15% global tariff quickly replaced the old framework, leaving the effective rate only slightly lower. Markets reacted, then moved on, as most of the inflation impact has already been absorbed.
SaaSpocalypse
If software stocks dominated your portfolio, the past few months have felt unsettling to say the least. Prices have come down sharply, volatility has picked up, and what once felt like a sure thing suddenly looks rather complicated. Broken is one way to describe it.
For nearly three years, artificial intelligence has been the defining investment theme. From the October 2022 low through September 2025, the average software and services stock in the Russell 1000 climbed 184 percent.1 Notable members of this industry include Microsoft, Accenture, Adobe, Intuit, and Oracle.
Generally, moves of this magnitude reflect serious conviction in a secular shift of higher earnings and value creation. Investors ultimately believed AI would expand margins, deepen competitive moats, and accelerate revenue growth across the software ecosystem. For a time, that belief was indeed rewarded.
Since the September 2025 software and services peak, however, the average software stock has fallen about 25% and now sits roughly 42% below its 52-week high.1 Ugly.
What was the cause of all this wreckage?
Well, the weakness intensified after the most recent wave of AI agent upgrades, including Claude’s update, which forced investors to reconsider something that had been easy to ignore. If AI can automate coding, research, customer support, and workflow management at increasing speed and lower cost, what happens to companies priced for persistent pricing power? Obsolescence it seems.
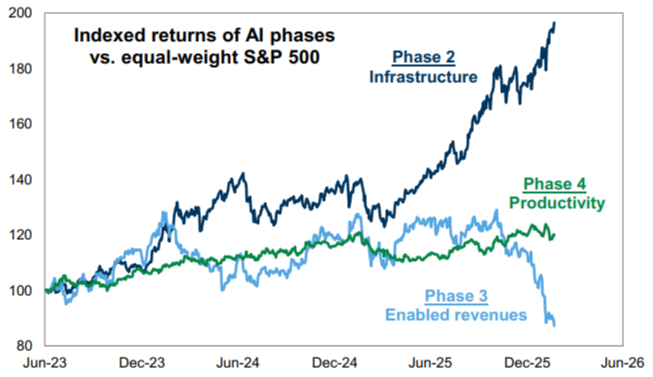
Source: Goldman Sachs Golbal Investment Research. Phase 2 (ticker: GSCBAIP2) represents stocks involved in the AI infrastructure build-out. Phase 3 (GSCBAIP3) represents stocks with the potential for AI-enabled revenues. Phase 4 (GSXUPROD, developed by Global Banking & Markets) represents non-technology stocks that may use AI to become more productive.
At the same time, the broader AI story is hardly collapsing. Over the last year, AI implementation companies, largely SaaS (software as a service) firms, have been crushed, while AI infrastructure companies have gained more than 60 percent.2
This divergence suggests the market is not retreating from AI but refining its view. Investors appear more confident in the builders of data centers, chips, and compute capacity than in some of the downstream applications that may face margin pressure. Capital spending reinforces that point. Hyperscaler AI spending on infrastructure and equipment for 2026 is projected at roughly $667 billion, about 62% higher than 2025 levels.2
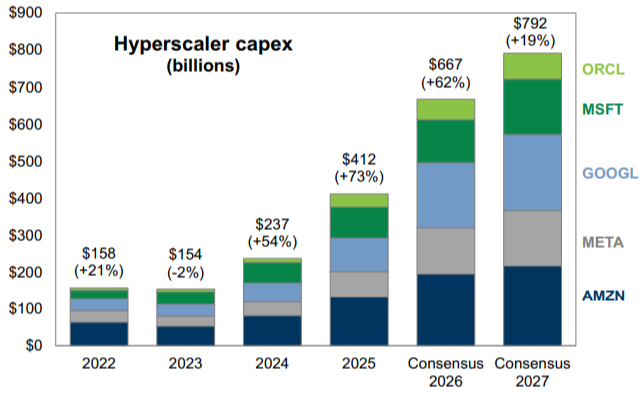
Source: Goldman Sachs Global Investment Research.
According to Goldman Sachs, the buildout continues at extraordinary scale, and analyst estimates suggest capex will account for more than 90% of hyperscaler free cash flows in 2026, above levels reached during the Dot Com Boom. Lower free cash flows mean less buybacks, less dividends, and more debt. This trend creates more uncertainty for investors, hence the weakness in these companies’ stock prices as of late.
Rotation Under the Hood
The gap between winners and losers extends well beyond the AI theme; it is part of a broader rotation that has been quietly reshaping the market.
In 2025, U.S. technology stocks gained 24% and communication services stocks rose 34%. Growth dominated and capital and flows concentrated in mega-cap leaders.
This year, leadership has rotated. As of February 24th, energy is up 23%, materials have advanced 17%, and consumer staples have gained nearly 16%, while technology is modestly negative year-to-date. Style performance tells a similar story. Year-to-date, the Russell 1000 Value ETF has outpaced its Growth counterpart by nearly 11 percentage points, rising 6.7% while the Growth ETF has declined 4.4%.
When valuations remain elevated and leadership has been concentrated for years, markets often broaden before they weaken. With the U.S. trading near 21.5 times forward earnings, investors have started to look for earnings visibility and tangible cash flow.
That search has extended beyond U.S. borders.

Source: Bloomberg. Data from 1/1/2026 to 2/24/2026. Emerging Markets represented by the MSCI EM NR Index, U.S. Stocks represented by the S&P 500 TR Index, and International Developed Stocks represented by the MSCI EAFE NR Index. Past performance is no guarantee of future results. Investors cannot invest directly in an index.
Emerging markets, long overshadowed by U.S. dominance, are quietly outperforming. The MSCI EM Index is up roughly 13% year-to-date, compared with about 1% for the S&P 500; meanwhile, the MSCI EAFE Index, representing international developed stocks, has gained close to 8%.
The gains seen within emerging markets are not merely multiple driven, either. Earnings expectations for 2026 have been revised 13% higher since the start of the year, rising from $106 to $120, according to Bloomberg. And according to Goldman Sachs, they are now forecasting 25% earnings growth for 2026, up from 19% previously.
After years of underperformance, improving fundamentals are being recognized, and capital flows are beginning to follow. As if that wasn’t enticing enough, valuations remain compelling at roughly 13 times forward earnings, a meaningful discount to the United States.
Tariff Update
On February 20th, in a 6-3 decision, the Supreme Court struck down the administration’s global tariffs imposed under the International Emergency Economic Powers Act, ruling that the 1977 emergency law did not authorize tariffs. The decision invalidated the April “Liberation Day” tariffs and the fentanyl-related duties on Canada, Mexico, and China.
Roughly $180 billion had already been collected under IEEPA authority, much of which could eventually be refunded.3 This ruling was anticipated, and, of course, the response was swift. The White House imposed a new 15% global tariff under Section 122 of the Trade Act, which is the maximum allowed under that provision.
While Section 122 tariffs expire after 150 days unless extended, the administration can pivot to Section 301 investigations or other authorities to keep tariffs in place. The overall impact appears modest, with the effective tariff rate estimated to fall from just over 10% to 9%.4 While the initial market reaction was positive, the gains faded quickly as the news was largely priced in and inflation estimates remained stable.
Big Picture
Overall, if we take a step back, the new pattern is clear. AI infrastructure momentum remains in place, while software and adjacent businesses face increasing scrutiny. Leadership is broadening beyond U.S. mega-cap growth into cyclicals, consumer staples, and emerging markets where earnings revisions are improving markedly. Trade policy feels like it’s now in the rearview mirror, with most of the inflation impact already behind us.
However, the core question remains: when will AI efficiencies manifest in the data to signal a broad-based productivity boost rather than a winner-take-all dynamic?
(1) Bespoke Investment Group. "The Bespoke Report: AI Boom to AI Doom." February 13, 2026. bespokepremium.com.
(2) Goldman Sachs. "US Equity Views: The broadening and narrowing of the AI trade." February 24, 2026. Portfolio Strategy Research. gs.com.
(3) "Trump's Options After Supreme Court Said His Tariffs Are Illegal." By Isabel Gottlieb. February 20, 2026. www.bloomberg.com.
(4) Goldman Sachs. "US Daily: Tariffs and the Economy After the Supreme Court Ruling." By Alec Phillips, Elsie Peng, and David Mericle. February 22, 2026. Economics Research. gs.com.
The S&P 500 Index is widely regarded as the best single gauge of the U.S. equities market. The index includes a representative sample of 500 leading companies in leading industries of the U.S. economy. The S&P 500 Index focuses on the large-cap segment of the market; however, since it includes a significant portion of the total value of the market, it also represents the market.
The MSCI EAFE Index measures the performance of the large and mid cap segments of developed markets, excluding the US & Canada equity securities. It is free float-adjusted market-capitalization weighted.
The MSCI Emerging Markets Index is a free float-adjusted market capitalization index that is designed to measure equity market performance in the global emerging markets.
IMPORTANT DISCLAIMERS AND DISCLOSURES
This presentation is for educational and illustrative purposes only. It is not intended to offer or deliver investment advice in any way. Past performance is not indicative of future results. The information contained in this presentation has been gathered from sources we believe to be reliable, but we do not guarantee the accuracy or completeness of such information, and we assume no liability for damages resulting from or arising out of the use of such information. Any projections, market outlooks, or estimates are based upon certain assumptions and should not be construed as indicative of actual events that will occur. The performance numbers displayed herein may have been adversely or favorably impacted by events and economic conditions that will not prevail in the future. Any index presented does not incur management fees, transaction costs or other expenses associated with investable products. It is not possible to directly invest in an index.
Nova R Wealth, Inc. is a registered investment advisor with the U.S. Securities and Exchange Commission. SEC registration does not constitute an endorsement of the firm by the Commission, nor does it indicate that the adviser or investment adviser representative has attained a particular level of skill or ability. Nova R provides investment advisory and related services for clients nationally. This material is proprietary and may not be reproduced, transferred, or distributed in any form without prior written permission from Nova R Wealth, who reserves the right at any time and without notice to change, amend, or cease publication of the information contained herein.