

Summary
- Inflation cooled down in June, a welcome change after the turbulent start to the year. However, the labor market is showing signs of weakness, raising concerns about a potential economic downturn given the restrictive level of interest rates.
- Positive trends in inflation data drove market participants to expect the first rate cut to start in September this year. Bond yields dipped, aiding performance for U.S. investment grade bonds, and even stocks inched higher for the month of July.
- Small-cap stocks have historically outperformed large-cap stocks, but this trend has reversed in recent years. Prices of goods and services slowing in June was the catalyst needed to cause a rotation. July was the second largest monthly outperformance for small caps since the bursting of the tech bubble in the early 2000s.
- At the July press conference, Chairman Jerome Powell signaled that the federal funds rate would be moving down in September, assuming no wild swings in inflation or employment data. This is a positive development after a few years of restrictive monetary policy aimed at slowing the economy.
July Economic & Market Update
When analyzing a stock to decide whether to buy, hold, or sell, there are typically only a few KPIs or data points worth considering. Everything else is noise.
Right now, to assess the overall barometer for the economy, inflation and the labor market are the data points worth studying, as they tend to move global equity and bond markets the most and determine the path forward for interest rates.
On the inflation front, the core personal consumption expenditure index, which excludes food and energy items, increased just 0.2% from May. If we take a look from a year ago, the index only rose 2.6%, according to the Bureau of Economic Analysis. This is a positive development, and the bond and equity markets took the news in stride, with bond yields dropping and the U.S. equity market rallying to finish the month.
For the full month of July, the S&P 500 Index, a gauge of large cap U.S. stocks, rose (+1.13%) on a price basis and U.S. investment grade bonds, represented by the Bloomberg US Aggregate Bond Index, increased a peachy (+2.34%).
Meanwhile, the U.S. labor market is causing angst and worry. Keeping interest rates high—after having raised them—will inevitably result in job losses. This, in turn, tends to suppress wage growth, which slows overall economic growth and eventually reduces inflation. That’s the theory, at least.
Examining key labor market indicators reveals a cooling from the overly heated levels of just two years ago. Companies are posting fewer job openings and job growth is clearly slowing. These trends are raising concerns that we may be on the brink of a downturn that could jeopardize the broader economy.
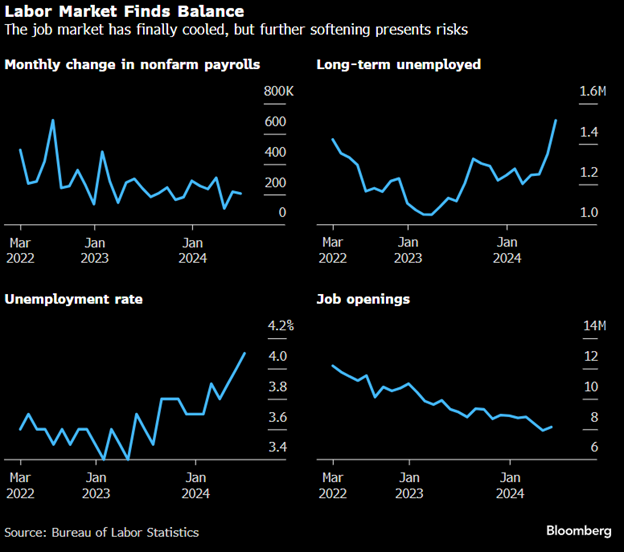
Data from 3/31/2022 to 6/30/2024.
Managing the delicate balance of reducing inflation while maintaining steady employment is a formidable challenge for the Fed. The coming months will be crucial in observing this trend, as it will likely be the key factor influencing the pace and strategy of future interest rate adjustments.
Small Cap Bonanza
For the past decade, asset managers' capital market estimates have consistently predicted that U.S. small-cap stocks would beat U.S. large-cap stocks. Why? Well, historically speaking, it worked in your favor from 1930 until 2010.
Below is a chart illustrating 3-year rolling relative annualized returns between U.S. small-cap stocks and U.S. large-cap stocks. When the squiggly line is positive, it means small-cap stocks are outperforming large-cap stocks. There have been six discernable periods of major outperformance for the sub-asset class. What you'll notice, though, is that the historical trend has not reemerged for quite some time. This is why asset managers are calling for future outperformance.
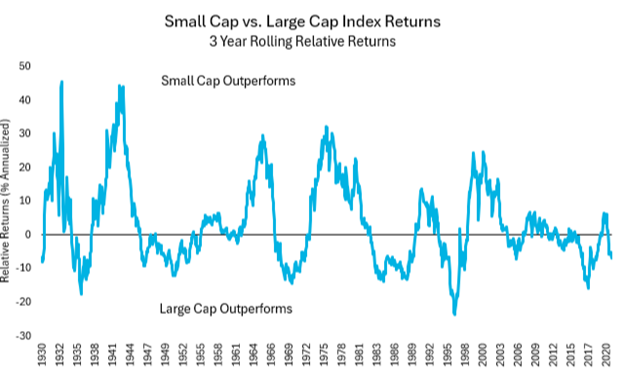
Source: SBBI Ibbotson. Morningstar. Nova R Wealth. Data from 1/1/1930 to 6/30/2024. Small Cap represented by IA SBBI US Small Stock TR USD Index, Large Cap represented by IA SBBI US Large Stock Tr USD Ext. Index; please see important disclosures at the end of this material.
The natural question then becomes, what are the reasons for the underperformance?
Michael Cembalest, author of Eye on the Market for JPMorgan, took a deep dive into this precarious situation and came up with a few answers.
First, relative to U.S. large cap stocks, U.S. small-cap stocks have more companies with negative earnings, lower returns on invested capital, lower free cash flow margins, and more floating rate debt (this constrains a business when interest rates are elevated). Not particularly encouraging.
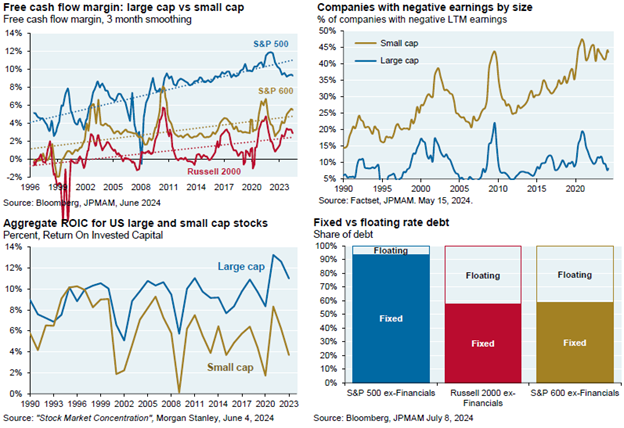
Source: JPMorgan, Eye on the Market: The Lion in Winter.
Second, if we take a look at valuations since the end of 2010, the price-to-earnings multiple actually contracted for the S&P 600 Index (U.S. small cap stock index). For the S&P 500 Index, the price-to-earnings multiple increased, providing a large tailwind to returns.
And third, absolute sector contribution hindered relative performance for small caps. For example, large-cap tech stocks have tripled the performance of small-cap tech since December 2010. Even worse, small cap sector underperformance doesn’t stop at technology companies; large cap also outperformed small cap in financials, health care, consumer discretionary, communication services, and energy. The author of the paper goes on to write that, “In fact, no small cap sector meaningfully outperformed large cap since 2010, particularly when looking at the Russell 2000 Index.”1
Naturally, for all these reasons, investors are hesitant to invest in this asset class.
So, with small-cap stocks trading at a discount to their large-cap brethren and rates potentially coming down, creating an opportunity for small companies to boost margins, does this mean the reversion towards the mean is on the horizon? Maybe. Maybe not. But after a better-than-expected June inflation report, signaling potential rate cuts and relief for small companies, the Russell 2000 Index had its largest monthly outperformance vs. the S&P 500 Index since the burst of the tech bubble in the early 2000s.
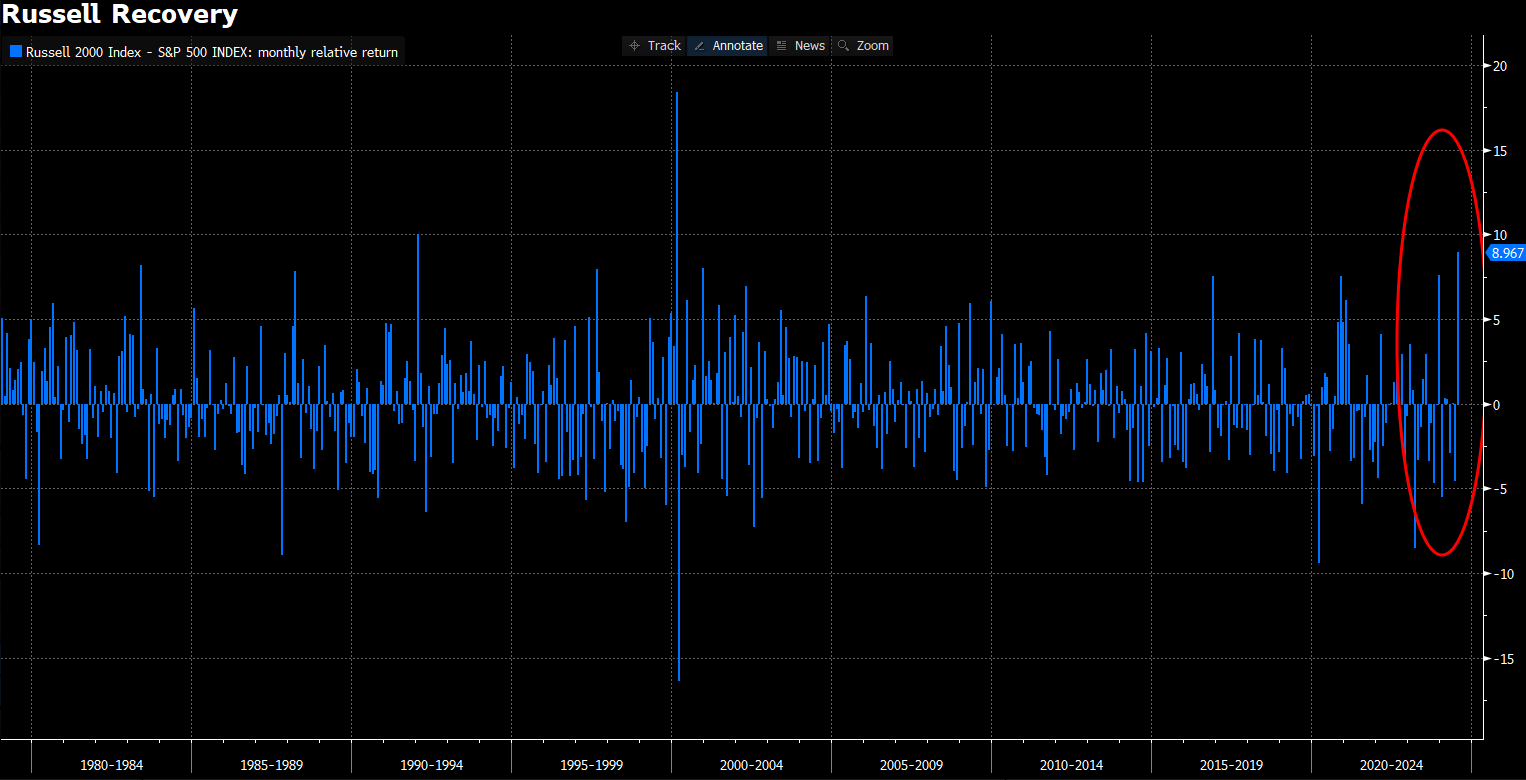
Source: Bloomberg. Nova R Wealth. Data from 1/31/1979 to 7/31/2024; please see important disclosures at the end of this material.
Could this be the start of a colossal rotation back into small-cap companies, creating relative outperformance moving forward? Diversified investors would like to think so, especially given today’s valuations offering the cheapest entry point in the 21st century.
Sticking the Landing
If you’ve been watching the Olympics, you’ve likely felt the vigor, excitement, and pride as Team USA’s women’s gymnastics team clinched the gold. Every jump, flip, and twist builds towards one ultimate goal: sticking the landing. Similarly, the Federal Reserve is attempting its own challenging feat—achieving a "soft landing" for the economy.
Approaching the Fed meeting on 7/31/2024, markets were predicting the central bank to signal a rate cut this coming September, according to Bloomberg. This was all but solidified after Fed Chairman Jerome Powell signaled that the Federal Open Market Committee is on course to cut rates in September unless inflation progress stalls. Barring the labor market holding steady and not deteriorating much further, this is good news, as lower rates should encourage more business and consumer spending. However, monetary policy takes time to have an effect, so don’t expect immediate changes just yet.
It seems that through all our country's twists and turns in the last couple of years, sticking a soft landing and receiving a gold medal may not be just for Team USA's women's gymnastics team.
- Cembalest, M. (2024, July 23). The Lion in Winter [Blog post]. J.P. Morgan Private Bank. Retrieved from https://privatebank.jpmorgan.com/nam/en/insights/latest-and-featured/eotm/the-lion-in-winter
The Bloomberg US Aggregate Bond TR Index measures the performance of investment grade, U.S. dollar-denominated, fixed-rate taxable bond market, including Treasuries, government-related and corporate securities, MBS (agency fixed-rate and hybrid ARM passthroughs), ABS, and CMBS.
The S&P 500 Index is widely regarded as the best single gauge of the U.S. equities market. The index includes a representative sample of 500 leading companies in leading industries of the U.S. economy. The S&P 500 Index focuses on the large-cap segment of the market; however, since it includes a significant portion of the total value of the market, it also represents the market.
The Russell 2000 Index measures the performance of the small-cap segment of the US equity universe. It is a subset of the Russell 3000 and includes approximately 2000 of the smallest securities based on a combination of their market cap and current index membership. Russell Investment Group is the source and owner of the trademarks, service marks and copyrights related to the Russell Indexes. Russell® is a trademark of Russell Investment Group.
The S&P 600 Index is a capitalization-weighted index that measures the performance of selected U.S. stocks with a small market capitalization.
The IA SBBI US Large Stock TR USD Ext Index tracks the monthly return of S&P 500. The history data from 1926 to 1969 is calculated by Ibbotson.
The IA SBBI US Small Stock TR USD Index measures the performance of DFA U.S. Micro Cap Portfolio net of fees and expenses. The fund is designed to capture the returns and diversification benefits of a broad cross-section of U.S. small companies on a market-cap weighted basis. The fund’s target buy range includes those companies whose market capitalization falls in the lowest 5 percent of the market universe defined as the aggregate of the NYSE, NYSE Amex, and NASDAQ National Market System or companies smaller than the 1,500th largest U.S. company in the same market universe, whichever results in a higher market capitalization break.
This presentation is for educational and illustrative purposes only. It is not intended to offer or deliver investment advice in any way. Past performance is not indicative of future results. The information contained in this presentation has been gathered from sources we believe to be reliable, but we do not guarantee the accuracy or completeness of such information, and we assume no liability for damages resulting from or arising out of the use of such information. Any projections, market outlooks, or estimates are based upon certain assumptions and should not be construed as indicative of actual events that will occur. The performance numbers displayed herein may have been adversely or favorably impacted by events and economic conditions that will not prevail in the future. Any index presented does not incur management fees, transaction costs or other expenses associated with investable products. It is not possible to directly invest in an index.
Nova R Wealth, Inc. is a registered investment advisor with the U.S. Securities and Exchange Commission. SEC registration does not constitute an endorsement of the firm by the Commission, nor does it indicate that the adviser or investment adviser representative has attained a particular level of skill or ability. Nova R provides investment advisory and related services for clients nationally. This material is proprietary and may not be reproduced, transferred, or distributed in any form without prior written permission from Nova R Wealth, who reserves the right at any time and without notice to change, amend, or cease publication of the information contained herein.