

Summary
- Following Trump's victory, U.S. stocks surged, with the S&P 500 up 2.5% and small-cap stocks gaining 5.8%. However, international markets dropped over 1%, influenced by concerns over tariffs, protectionism, and a stronger U.S. dollar. While equities benefited from optimism around lower corporate taxes and deregulation, fixed income markets showed modest gains, and gold slumped due to rising real yields.
- Trump’s potential policies, such as extending tax cuts and imposing tariffs, could lead to higher deficits and tighter financial conditions, though they might slightly boost corporate earnings. Deregulation, particularly for banks and energy companies, could stimulate growth, while less aggressive antitrust enforcement may lead to more mergers and acquisitions.
- The Federal Reserve cut rates by 0.25% to a range of 4.50%-4.75%, marking the second cut of the year. Despite concerns over Trump’s influence on the Fed, Chair Powell reassured markets that the election wouldn’t alter monetary policy. Another rate cut is likely in December, but the outlook for future cuts has become less certain.
- With the election outcome settled, the next wave of uncertainty comes from the potential economic and market paths under the new administration. Despite strong market returns under different administrations, unpredictable macro forces—such as supply and demand dynamics, interest rates, and inflation—are more influential than policy alone. A diversified portfolio remains the best strategy for managing this uncertainty.
It’s finally over. We now know the outcome, with former President Trump declared the winner of the U.S. Presidential election. Beyond the presidential result, the nation also learned that Republicans have secured control of both houses of Congress, giving them significant influence over the legislative agenda.
In this post, we’ll explore the market reaction, policy implications, updates on interest rate policy, and key takeaways.
Market Reaction
As Trump’s presidential victory was confirmed and markets opened on November 6th, U.S. stocks took off, kicking off a rally. The S&P 500 Index closed the day up 2.5%, while small-cap stocks surged 5.8%. That said, international developed and emerging market stocks dropped over 1%, driven by concerns over protectionist policies and tariffs, with a rising U.S. dollar further weighing on these markets.
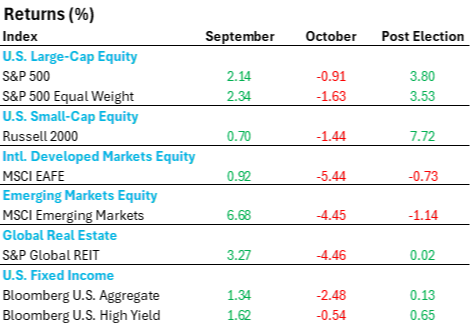
Source: Source: Morningstar Direct. Nova R Wealth. September and October are 2024 monthly returns. Post-election returns are from 11/6/2025 to 11/11/2024. See important disclosures at the end of this material.
The mere suggestion of lower corporate taxes, less regulation, and faster real growth sent parts of the stock market into an excitable frenzy. Naturally, small-cap stocks—always eager for a growth story—outshone their larger, higher quality peers. On a sector basis, economically sensitive groups like consumer discretionary, financials, and industrials posted strong gains.
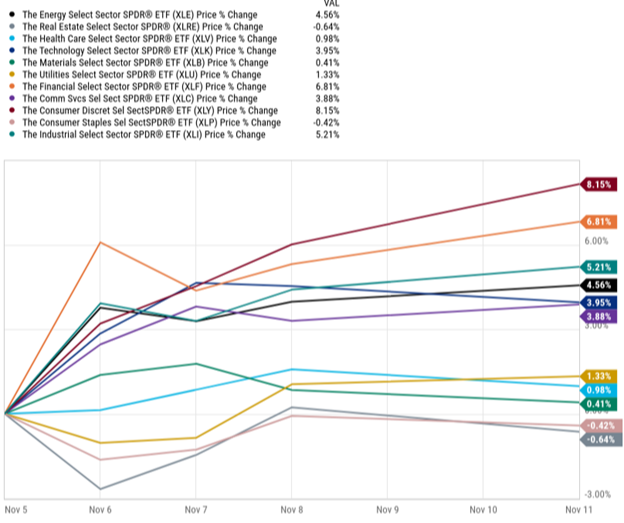
Source: YCharts. Nova R Wealth. Data from 11/5/2024-11/11/2024.
Fixed income markets didn't put on much of a show. U.S. investment-grade bonds, as represented by the Bloomberg U.S. Aggregate Bond Index, eked out modest gains even as yields inched higher. Meanwhile, high-yield bonds, which are more closely tied to equity market performance, experienced stronger returns, highlighting their riskier but more rewarding profile in such conditions.
Elsewhere, in currency and commodity markets, the U.S. dollar strengthened by more than 2% against a basket of other currencies, lifted by rising real interest rates and an improving economic outlook. This same increase in real yields weighed heavily on gold, which slumped over 5%, as non-yielding assets tend to suffer in such environments.
Policy Implications
With election uncertainty behind us, investors will focus on policy priorities and implementation vs. what was promised. We’ve argued that economic conditions are a bigger driver of returns than political cycles, but government policy can still influence outcomes, even if just on the margin.
- Fiscal: Trump has floated the idea of fully extending the 2017 Tax Cuts and Jobs Act, keeping the top tax rate at 37% and possibly cutting the corporate tax rate for domestic manufacturers from 21% to 15%.1 But without matching spending cuts, this move risks ballooning the deficit even more, which could spook bond markets and push yields higher, tightening financial conditions and boosting the interest burden. On the flip side, corporate earnings might see a small lift, though it won’t be as pronounced this time around.
- Trade and Tariffs: A major voter draw was Trump’s tough stance on tariffs, and he’d have the executive power to act on it, proposing a 10% tariff on all imports and a hefty 60% on Chinese goods.1 Such moves would likely stoke inflation, pushing yields higher and potentially disrupting the Fed’s rate-cutting plans. On the other hand, more companies might bring production back to the U.S., boosting domestic jobs and possibly sparking increased competition between big and small firms.
- Regulation: President-elect Trump has called for sweeping deregulation, though the specifics remain vague. Broadly, banks and energy firms could be the biggest winners from a lighter regulatory touch. Meanwhile, a shakeup at the DOJ and FTC could mean less aggressive antitrust enforcement, paving the way for more mergers and acquisitions.
Federal Reserve Update
Amid all the noise and drama surrounding the election outcome, it was kind of easy to forget that there was a Federal Reserve meeting lurking around the corner. Leading up to the rate decision on November 7th, traders were pricing in a 100% probability that interest rates would be cut 0.25%. Sure enough, that’s what the market got, and the federal funds rate is now in the range of 4.50%-4.75%, down from 5.25%-5.50% at the start of the year.
This was the second rate cut this year, although only half the size of the 0.50% reduction announced in September. Investors had plenty on their minds during the Fed’s press conference, with concerns about the impact of the upcoming election and the persistent question of whether former President Trump could fire Jerome Powell. However, Chair Powell was quick to dismiss these worries. He emphasized that the election won’t influence the Federal Reserve’s current outlook on monetary policy until more is known. Furthermore, Powell made it clear that Trump does not have the legal authority to remove him from his position before the end of his term in 2026, providing some reassurance to those concerned about potential political meddling.
Ultimately, barring an unexpected jump in inflation or employment, there is a high probability that we will see another 0.25% interest rate cut in December. Beyond that, there are now just four full additional 0.25% rate cuts priced in for this cycle, which is a large deviation from when the Fed cut in September.
Looking back to September, market participants were projecting the federal funds rate to end closer to 3%, a far cry from the more recent 3.75% figure.
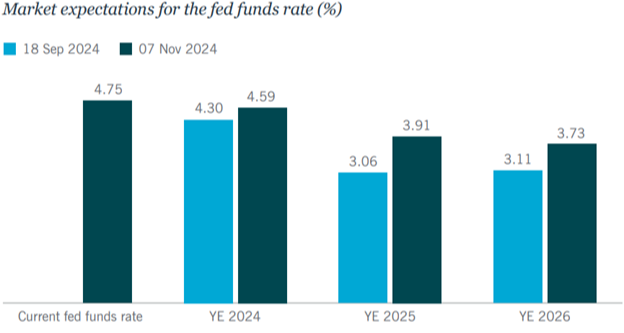
Source: Nuveen. Bloomberg, L.P., November 7, 2024.
Navigating Uncertainty
The uncertainty of the presidential race is behind us, but the next wave comes from the potential economic and market trajectories under the new administration.
Here are three important reminders while we sail unchartered waters:
- Market returns have been strong under both political regimes. In our last blog post, we explored this in detail, concluding that while equity returns are generally positive across different presidential terms, it's the unpredictable macro environment that ultimately holds the upper hand.
- Unpredictable macro forces carry more weight. As we mentioned earlier, while policy can influence markets, it’s rarely the dominant force driving returns. During President Trump’s term, despite his strong support for traditional energy, the S&P 500 Energy Index fell 40%, while the S&P 500 Global Clean Energy Index soared 275%. In contrast, under President Biden, who has prioritized scaling back fossil fuels in favor of renewables, the S&P 500 Energy Index has more than doubled, and the Global Clean Energy Index has dropped over 50%.2 The takeaway? Even if you know the policies in advance, markets often react in ways that defy expectations, with factors like supply and demand, interest rates, and inflation playing a bigger role.
- A diversified portfolio is the best defense against the unknown. All crystal balls are cloudy, but for now, U.S. corporate earnings remain strong and continue to exceed expectations. Unemployment appears stable, inflation is more manageable, and the Federal Reserve seems poised to continue rate cuts, fostering a more favorable lending environment. Taking a long-term perspective, focusing on the key drivers of expected returns, and maintaining a diversified asset allocation aligned with our clients' needs and goals is, we believe, the best strategy for navigating these volatile times.
(1) Tax Foundation. "Donald Trump Tax Plan 2024." Tax Foundation, 11/14/2024. https://taxfoundation.org/research/all/federal/donald-trump-tax-plan-2024/.
(2) J.P. Morgan Asset Management. "The 2024 Presidential Election: What Do We Know and What Does This Mean for My Investments?" J.P. Morgan, 11/14/2024. https://am.jpmorgan.com/us/en/asset-management/adv/insights/market-insights/market-updates/on-the-minds-of-investors/the-2024-presidential-election-what-do-we-know-and-what-does-this-mean-for-my-investments/.
The S&P Global REIT Index measures the performance of publicly traded equity REITs listed in both developed and emerging markets. It is a member of the S&P Global Property Index Series.
The Bloomberg US Aggregate Bond TR Index measures the performance of investment grade, U.S. dollar-denominated, fixed-rate taxable bond market, including Treasuries, government-related and corporate securities, MBS (agency fixed-rate and hybrid ARM passthroughs), ABS, and CMBS.
The Bloomberg US Corporate High Yield Index measures the USD-denominated, high yield, fixed-rate corporate bond market. Securities are classified as high yield if the middle rating of Moody’s, Fitch and S&P is Ba1/BB+/BB+ or below.
The S&P 500 Index is widely regarded as the best single gauge of the U.S. equities market. The index includes a representative sample of 500 leading companies in leading industries of the U.S. economy. The S&P 500 Index focuses on the large-cap segment of the market; however, since it includes a significant portion of the total value of the market, it also represents the market.
The S&P 500 Equal Weighted Index is the equal-weight version of the widely-used S&P 500. The index includes the same constituents as the capitalization weighted S&P 500, but each company in the S&P 500 EWI is allocated a fixed weight – or 0.2% of the index total at each quarterly rebalance.
The Russell 2000 Index measures the performance of the small-cap segment of the US equity universe. It is a subset of the Russell 3000 and includes approximately 2000 of the smallest securities based on a combination of their market cap and current index membership. Russell Investment Group is the source and owner of the trademarks, service marks and copyrights related to the Russell Indexes. Russell® is a trademark of Russell Investment Group.
The MSCI EAFE Index measures the performance of the large and mid cap segments of developed markets, excluding the US & Canada equity securities. It is free float-adjusted market-capitalization weighted.
The MSCI Emerging Markets Index is a free float-adjusted market capitalization index that is designed to measure equity market performance in the global emerging markets.
IMPORTANT DISCLAIMERS AND DISCLOSURES
This presentation is for educational and illustrative purposes only. It is not intended to offer or deliver investment advice in any way. Past performance is not indicative of future results. The information contained in this presentation has been gathered from sources we believe to be reliable, but we do not guarantee the accuracy or completeness of such information, and we assume no liability for damages resulting from or arising out of the use of such information. Any projections, market outlooks, or estimates are based upon certain assumptions and should not be construed as indicative of actual events that will occur. The performance numbers displayed herein may have been adversely or favorably impacted by events and economic conditions that will not prevail in the future. Any index presented does not incur management fees, transaction costs or other expenses associated with investable products. It is not possible to directly invest in an index.
Nova R Wealth, Inc. is a registered investment advisor with the U.S. Securities and Exchange Commission. SEC registration does not constitute an endorsement of the firm by the Commission, nor does it indicate that the adviser or investment adviser representative has attained a particular level of skill or ability. Nova R provides investment advisory and related services for clients nationally. This material is proprietary and may not be reproduced, transferred, or distributed in any form without prior written permission from Nova R Wealth, who reserves the right at any time and without notice to change, amend, or cease publication of the information contained herein.