

Summary
- Tariffs Hit Again: Markets fell sharply following an unexpected and aggressive trade policy shift, sparking recession fears and a broad-based selloff across asset classes.
- Retaliation: The S&P 500 lost nearly 5% in a single day, and tech stocks, particularly, were hit hard. The volatility was exacerbated by retaliation from China, which only deepened concerns about escalating trade tensions and their potential impact on global growth.
- Current Focus: Despite the market turbulence, corrections offer valuable opportunities to reassess expected returns, engage in tax-loss harvesting, rebalance portfolios, and consider Roth conversions.
- Cutting Through the Noise: Reacting emotionally can be costly—sticking with your plan and leaning on a thoughtful, evidence-based strategy, we believe, is the best way forward.
“Every past decline looks like an opportunity; every future decline looks like a risk.” – Morgan Housel
The Cause
Even before “Liberation Day,” markets had been off to a challenging start. The S&P 500 Index was already down 3.6% for the year, with growth and small-cap stocks faring even worse. Investors were grappling with signs of a slowing economy and uncertainty around the Administration’s trade policy—particularly with key partners like Canada and Mexico.
While reciprocal tariffs were anticipated, they were not expected to be significant in scale. After all, the average tariff on U.S. goods from other countries stood at a relatively modest 4.6%.1 But that’s not what played out…
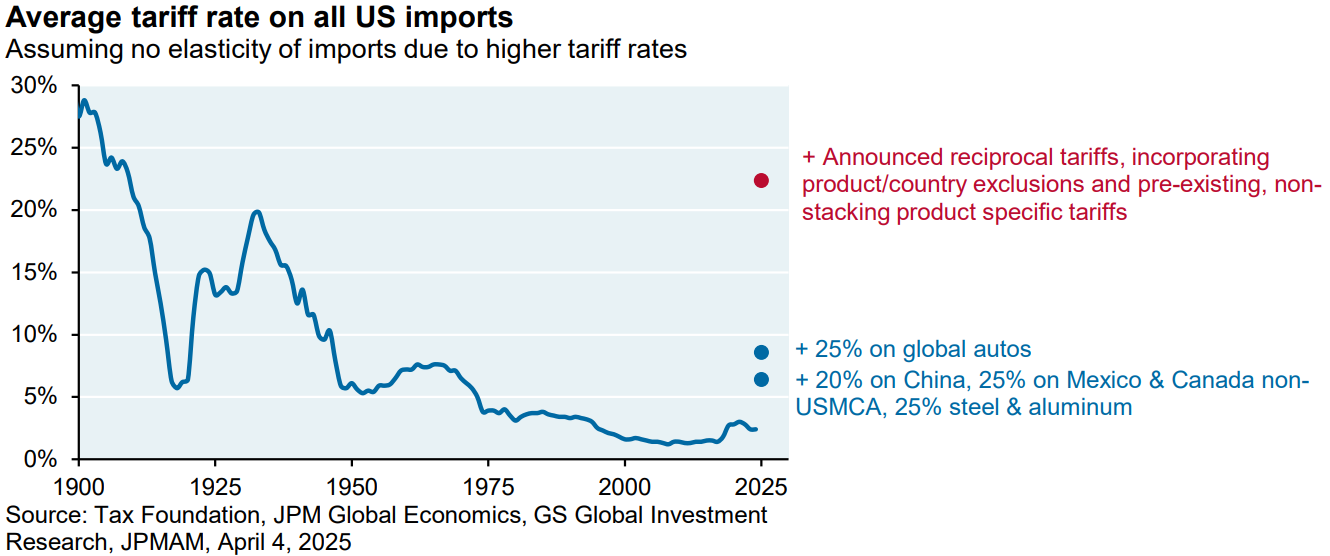
During the announcement on April 2nd, the President unveiled a new trade policy that included a blanket 10% tariff, coupled with significantly higher reciprocal tariffs across most countries. JPMorgan estimated the effective average tariff rate could rise to 25%—surpassing even the 20% average rate under the Smoot-Hawley Tariff Act of 1930, which many economists view as having exacerbated the Great Depression.
What really surprised markets wasn’t just the scale—it was the explanation. A handout showed tariffs supposedly based on what other countries charge us, with the idea that this was just "leveling the playing field." But the numbers didn’t line up.
As an illustration of the data used to justify the tariff policy, the Administration claimed that the European Union imposes a 39% tariff on U.S. imports. However, according to the World Trade Organization, the actual average tariff applied by the EU to U.S. goods is just 2.7%.
Further analysis from the American Enterprise Institute revealed that the formula published by the Office of the U.S. Trade Representative was misapplied. When corrected, it would reduce the tariffs assumed to be applied by each country to the United States to about a FOURTH of their stated level. If applied in a consistent manner, the tariff rate would not have exceeded 14% for any country.2
Market Reaction
After President Trump spoke in the Rose Garden on April 2nd, markets dropped—fast. The S&P 500 Index lost almost 5% the next day, and then nearly 6% more after China introduced retaliatory tariffs and announced export restrictions on rare earth metals. That kind of drop feels like the market is saying, “We really don’t like where this is going.” As of April 4th, the S&P is down over 17% from its highs, and the NASDAQ—which is an index mostly comprised of tech stocks—is down more than 20%. That’s officially a bear market.
The speed and magnitude of the drop looks almost like a data error. However, historical data shows that sharp market corrections of this nature, while uncomfortable, are not unprecedented. For instance, the market exhibited similar behavior during the COVID-19 drawdown in March 2020.
For a moment, international stocks looked like a safe spot. But when fear spreads, everything tends to fall together. It’s a reminder that markets are built on confidence in the short term, and when confidence breaks, even the strong get pulled down.
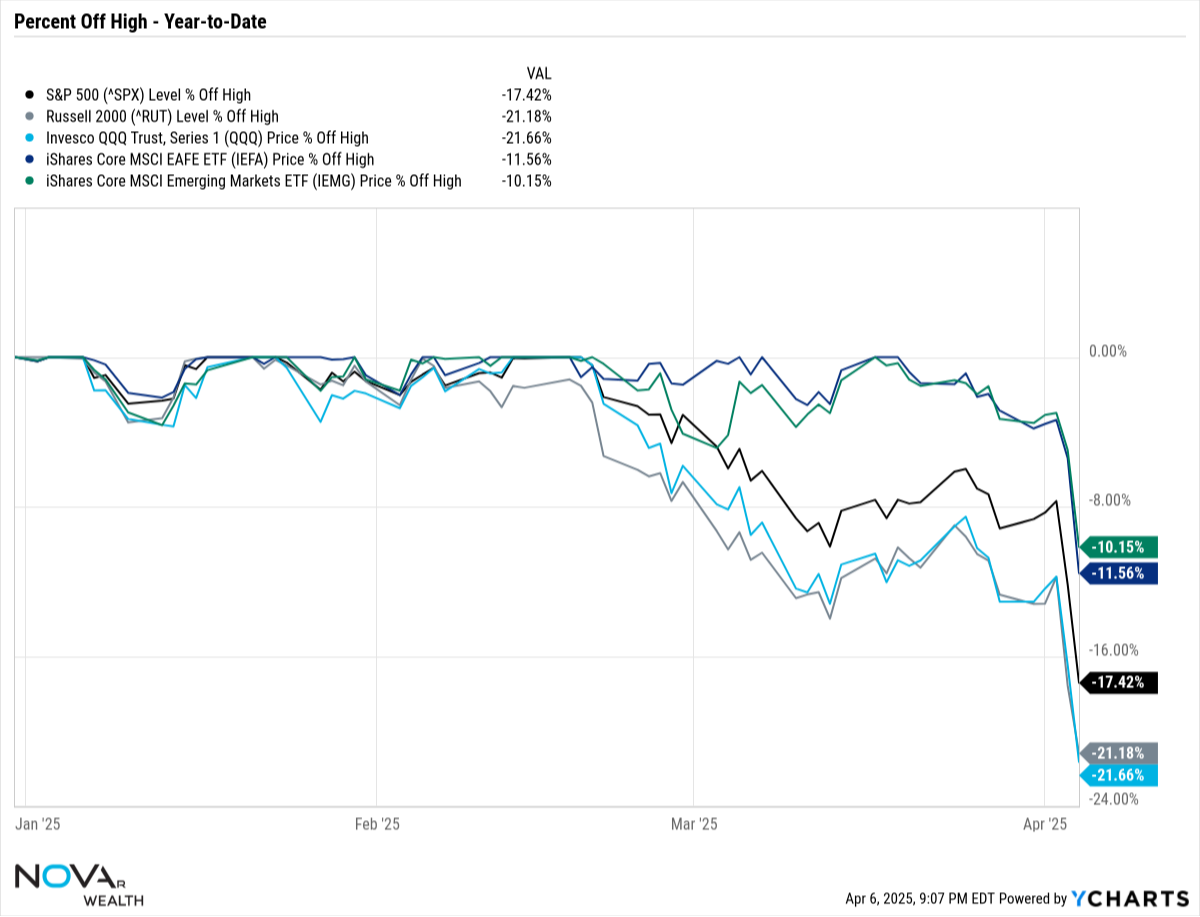
Source: YCharts. Nova R Wealth. Data from 1/1/2025 to 4/4/2025.
Dig a little deeper, and you’ll see just how rough it’s been: the average stock in the Russell 1000 Index (an index that represents the top 1,000 companies by market capitalization in the United States) has fallen 11.1% in just two days since President Trump’s Liberation Day speech. Since he took office in January, the average stock is down 15.7%. But here’s the real shocker—the average stock is trading more than 30% below its 52-week high, suggesting the breadth of the decline has been substantial.
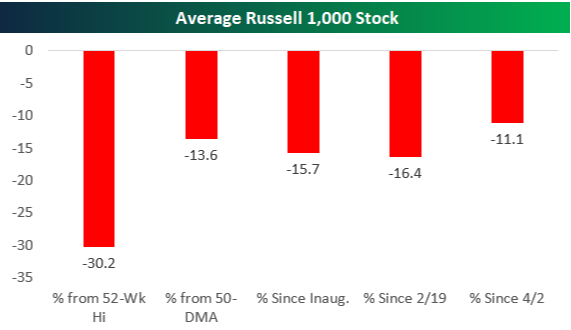
Source: Bespoke investment Group.
Tech is getting clobbered because it turns out that making gadgets with parts from China becomes expensive when you slap a 34% tariff on them. That, plus the fact that these stocks were priced for perfection. It’s a bad combination. The energy sector is down too, and these stocks have declined as recession probabilities have risen, reflected in the 11% year-to-date drop in crude oil prices.
But there is a silver lining. Bonds are quietly having a moment. Driven by economic slowdown fears, falling yields have propelled U.S. investment-grade bonds, as represented by the Bloomberg US Aggregate Bond Index, to a 3.69% gain. Nevertheless, investors are squinting into the distance—wondering whether the short-term fear (recession) gets replaced by the long-term fear (inflation and debt). Real assets, like infrastructure and real estate, are holding up better. Because when you’re not sure what’s going to happen, owning a toll road starts to look oddly comforting.
History As Our Guide
If you’ve been investing for a while, this isn’t your first correction—and it won’t be your last. Stocks fall 10% or more about once every year or two. They drop 20% every four years or so. A 30% drawdown? Roughly once a decade. In other words, this kind of thing happens more than we’d like, but less than we fear.
The real question now is: how bad can it get?
What tends to determine the depth and duration of a market decline is whether the economy falls into recession. On average, recessionary bear markets have seen losses of about 37%, while non-recessionary bear markets tend to be shallower, averaging around 23%. That said, averages are only helpful up to a point. Each cycle is different, and even if a recession does occur, it doesn’t guarantee significantly deeper losses from current levels.
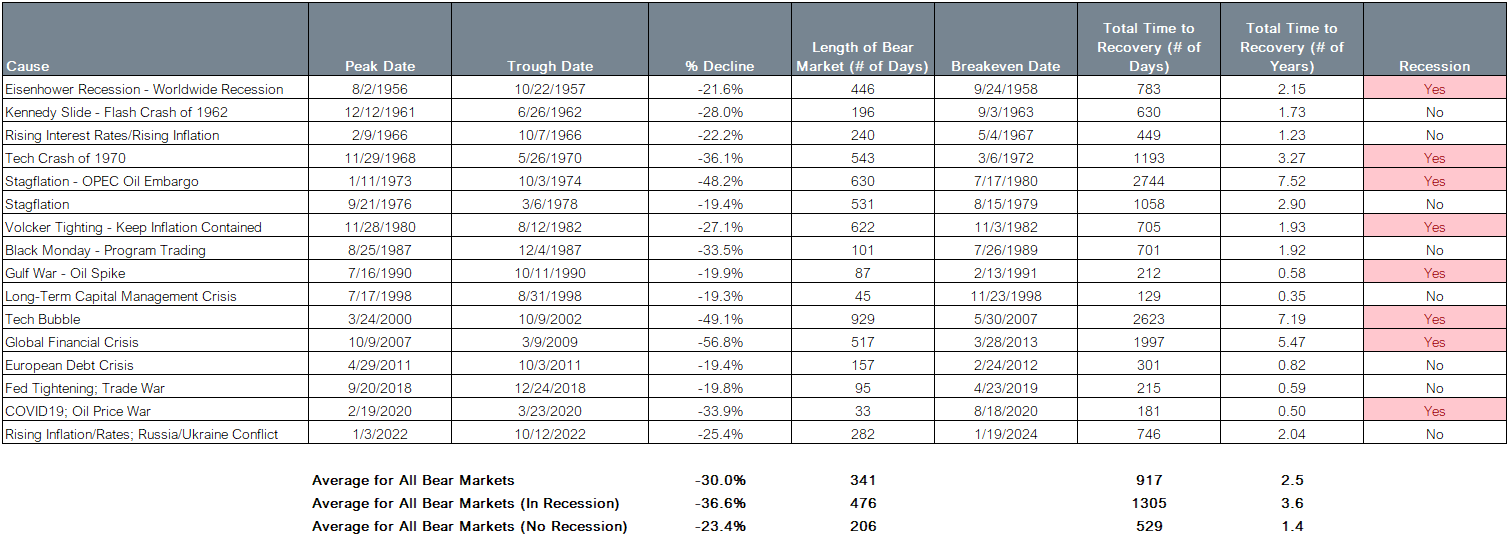
Source: Bloomberg. Nova R Wealth.
When markets fall, the temptation to “do something” is strong. You want to avoid more pain, and it feels like stepping aside for a bit could help. While the idea of exiting before the decline and re-entering just as the recovery begins is appealing, the reality is that such market timing requires precision that even professional investors fail to achieve.
The greater risk in trying to avoid losses during drawdowns is missing the initial stages of the recovery—often the strongest part of a bull market. Numerous studies have shown that being out of the market for just a few of the best days can significantly reduce long-term returns. Rather than trying to time the market, investors are better served by staying the course and maintaining discipline.
What We’re Focused On
Expected returns on assets such as stocks and bonds are not static—they fluctuate as market conditions change. Periods of dislocation, like the one we’re in now, can lead to significant shifts in forward-looking return expectations. Such environments may present opportunities to improve the portfolio's risk-adjusted return profile. That doesn’t always mean action is required—in fact, often the best course is to stay the course. But in other cases, more meaningful adjustments may be warranted.
In addition to monitoring expected returns, we’re also paying close attention to other key factors that could affect our clients' plans
- Tax-loss harvesting: Market downturns are never fun, but they can present an opportunity for tax-conscious investors. If you hold investments in a taxable account, a decline in the market may offer a chance to harvest losses—selling securities that are worth less than what you paid for them. Those realized losses can be used to offset capital gains elsewhere in your portfolio, and if your losses exceed your gains, you can use up to $3,000 per year to offset ordinary income. Even better, any unused losses can be carried forward to future tax years, offering ongoing tax benefits down the line.
- Rebalancing: Every investment strategy we build is customized to reflect your unique situation—your goals, risk tolerance, return expectations, liquidity needs, and tax picture. That’s what shapes your strategic asset allocation, like a 70/30 mix of stocks and bonds. But markets don’t stay still. During a downturn, for instance, your portfolio might shift to 65% stocks and 35% bonds simply because stock prices have dropped. In those moments, we’re not reacting emotionally—we’re rebalancing. That means trimming back on bonds that have held up better and buying stocks while they’re cheaper, all to realign your portfolio with the plan we created together. It’s not about trying to time the market—it’s about staying true to your long-term strategy.
- Roth Conversion: Declines in the market can provide an opportunity for a Roth IRA conversion. Lower account values mean you can convert more assets for the same cost than when markets were elevated. However, Roth conversions require careful analysis of long-term tax implications, including marginal tax rates, Medicare surcharges, and estate planning goals. Before moving forward, we’ll want to run the numbers and coordinate with your tax advisor to make sure it’s the right choice for you.
Drawdowns typically don’t last long. In the moment, though, they can feel like an eternity. It’s hard not to stay glued to your phone, reading every headline seemingly getting worse and worse. Attempting to make sense of the noise is natural, but making big, gut-driven decisions—like walking away from a well-thought-out financial plan—can sometimes do more harm than good.
Instead, lean on your plan, and lean on us. We’re here to talk through your questions, but more importantly, to help address the concerns that may be keeping you up at night. History reminds us that we’ve faced difficult moments before—and come through them. This time is no different.
(1) "Tariff Turmoil and Investment Strategy." J.P. Morgan Asset Management, April 7, 2025. https://am.jpmorgan.com/us/en/asset-management/adv/insights/market-insights/market-updates/notes-on-the-week-ahead/tariff-turmoil-and-investment-strategy/
(2) Viard, A. (2019, August 16). President Trump’s tariff formula makes no economic sense. It’s also based on an error. American Enterprise Institute. https://www.aei.org/economics/president-trumps-tariff-formula-makes-no-economic-sense-its-also-based-on-an-error/
The Bloomberg US Aggregate Bond TR Index measures the performance of investment grade, U.S. dollar-denominated, fixed-rate taxable bond market, including Treasuries, government-related and corporate securities, MBS (agency fixed-rate and hybrid ARM passthroughs), ABS, and CMBS.
The S&P 500 Index is widely regarded as the best single gauge of the U.S. equities market. The index includes a representative sample of 500 leading companies in leading industries of the U.S. economy. The S&P 500 Index focuses on the large-cap segment of the market; however, since it includes a significant portion of the total value of the market, it also represents the market.
The Russell 1000 Index measures the performance of the large-cap segment of the US equity universe. The Russell 1000 Index is a subset of the Russell 3000® Index which is designed to represent approximately 98% of the investable US equity market. It includes approximately 1,000 of the largest securities based on a combination of their market cap and current index membership.
IMPORTANT DISCLAIMERS AND DISCLOSURES
This presentation is for educational and illustrative purposes only. It is not intended to offer or deliver investment advice in any way. Past performance is not indicative of future results. The information contained in this presentation has been gathered from sources we believe to be reliable, but we do not guarantee the accuracy or completeness of such information, and we assume no liability for damages resulting from or arising out of the use of such information. Any projections, market outlooks, or estimates are based upon certain assumptions and should not be construed as indicative of actual events that will occur. The performance numbers displayed herein may have been adversely or favorably impacted by events and economic conditions that will not prevail in the future. Any index presented does not incur management fees, transaction costs or other expenses associated with investable products. It is not possible to directly invest in an index.
Nova R Wealth, Inc. is a registered investment advisor with the U.S. Securities and Exchange Commission. SEC registration does not constitute an endorsement of the firm by the Commission, nor does it indicate that the adviser or investment adviser representative has attained a particular level of skill or ability. Nova R provides investment advisory and related services for clients nationally. This material is proprietary and may not be reproduced, transferred, or distributed in any form without prior written permission from Nova R Wealth, who reserves the right at any time and without notice to change, amend, or cease publication of the information contained herein.