

Summary
- Consumer sentiment dropped in May due to concerns about the potential for rising unemployment, elevated interest rates, and worrisome business conditions.
- Despite the weak sentiment, the stock and bond market rebounded in May because weaker-than-expected labor growth and lower wages signaled that the Federal Reserve might lower interest rates sooner than later.
- Strong earnings growth, particularly from large technology companies, was another factor in the May stock market rebound. While overall S&P 500 earnings are on track for a surprising 7.77% gain in Q1, it's important to understand that this growth isn't evenly distributed.
- For the market to continue its ascent higher, the rest of the stock market cohort will have to recover and drive earnings higher.
During April, the world was shaken—literally and figuratively—by devastating earthquakes that rocked Taiwan and sent ripples of anxiety all the way to New York City. Not much relief occurred in May. Closer to home, tornadoes unleashed their fury across the Midwest and South, tearing through states such as Missouri, Nebraska, Oklahoma, and Texas.
Mirroring the natural disasters, risk assets—such as U.S. and international stocks and bonds—were rattled in April as a consequence of inflation coming in higher-than-expected, rising bond yields, and reduced expectations for interest rate cuts in 2024. This trifecta of sobering news drove down prices and dampened consumer sentiment.
How Are We Feeling
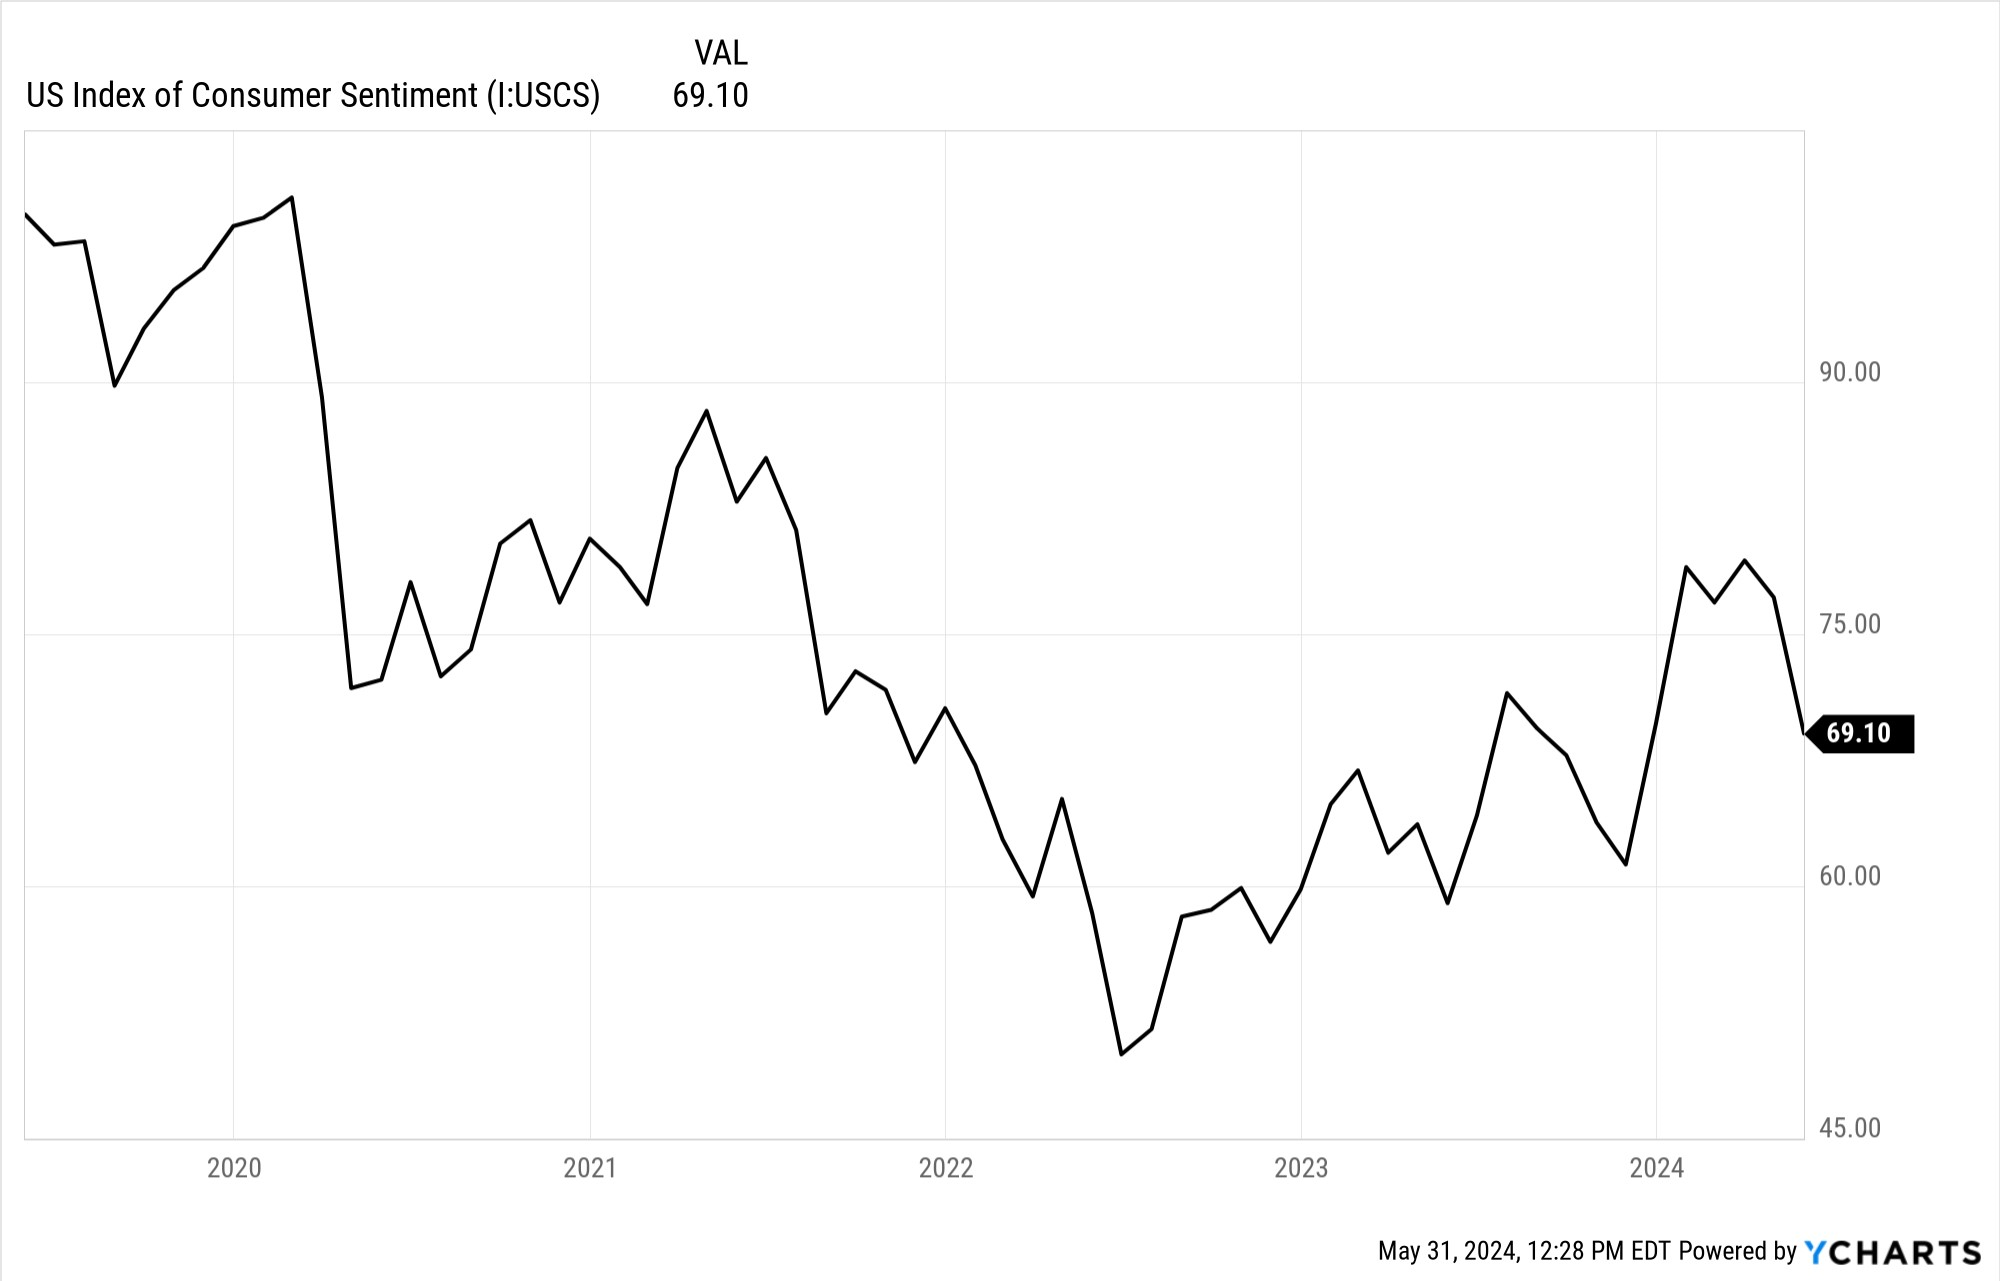
One way to gauge consumer sentiment is the University of Michigan Consumer Confidence Index. This survey collects data on consumer attitudes and expectations in order to evaluate changes in customers' desire to buy and forecast their future discretionary spending.1 Given that consumer spending drives earnings growth at corporations, this survey can be important to market participants.
Source: University of Michigan. YCharts. Data from 5/31/2019 to 5/31/2024.
The latest reading in May dropped by roughly 10%, bringing the index to its lowest level in five months. Why such a significant decline, given that real GDP growth is tracking close to trend and the U.S. stock market hovers near all-time highs?
According to the most recent release, the cause for the deterioration was a decline in the year-ahead outlook for business conditions, concern over the prospect of rising unemployment, and elevated interest rates. These answers make perfect sense as to why sentiment is in the dumps, but we believe it goes a bit deeper and relates back to wages.
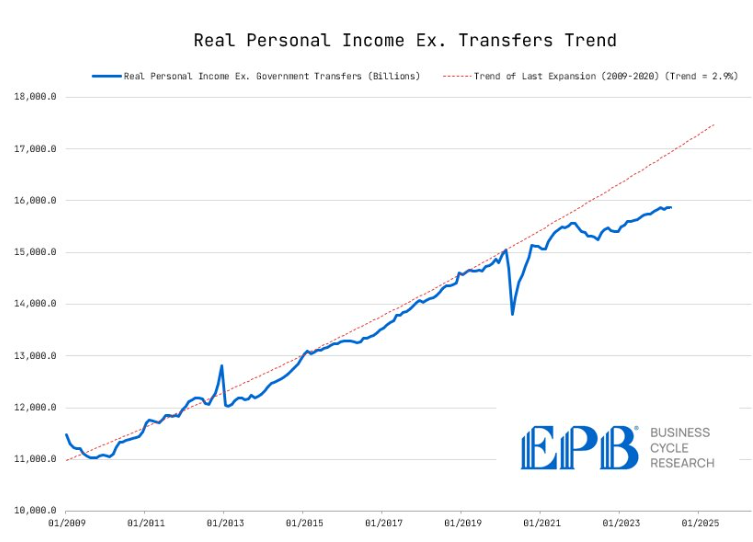
For example, according to Eric Basmajian, head of EPB Research, real private sector income grew at a 2.9% annualized rate from 2009-2020. Since 2020, real private income has only risen at a 1.3% rate.2 Sure, it doesn’t sound like too big of a difference, but it is. The gap between today’s income level and the pre-Covid trend is greater than $1 trillion.
Source: EPB Research. Data from 1/1/2009 to 4/30/2024.
Put more simply, wages can’t buy what they used to, and it could be a while before earnings catch up to the price increases that have already taken place for goods and services.
May Flowers
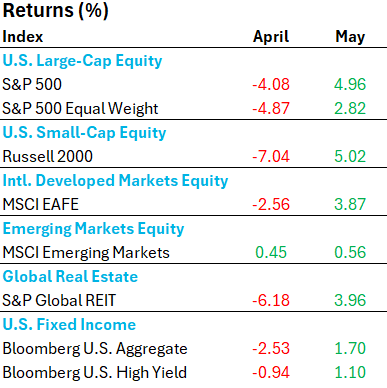
Despite softening consumer sentiment, April's market downturn gave way to a May rebound, with some assets blooming more brightly than others. The old adage, 'Sell in May and go away,' did not apply this year.
Source: Morningstar Direct. Nova R Wealth. April data is from 4/1/2024 to 4/30/2024 and May data is from 5/1/2024 to 5/31/2024. See important disclosures at the end of this material.
The bounce back in May for both stocks and bonds alike started early in the month. And the reason? Less job growth. According to the Bureau of Labor Statistics, nonfarm payrolls increased 175,000 for the month of April, which was the smallest gain in six months. On top of that, average hourly earnings only jumped 0.2% from March, the slowest pace since June 2021.3
Why would less jobs and lower wages, which signal a weaker economy, increase the prices for stocks and bonds? Well, in this particular case, the market is sniffing for any news that will bring down interest rates. Higher unemployment, lower wages, and lower inflation act as indicators that interest rates may come down sooner rather than later. The objective for the Federal Reserve, however, is to achieve a careful balance between a weaker-than-expected labor market and lower inflation versus massive job losses and deflation. This delicate balance seems to be moving in the Fed’s favor for now.
Earnings Update
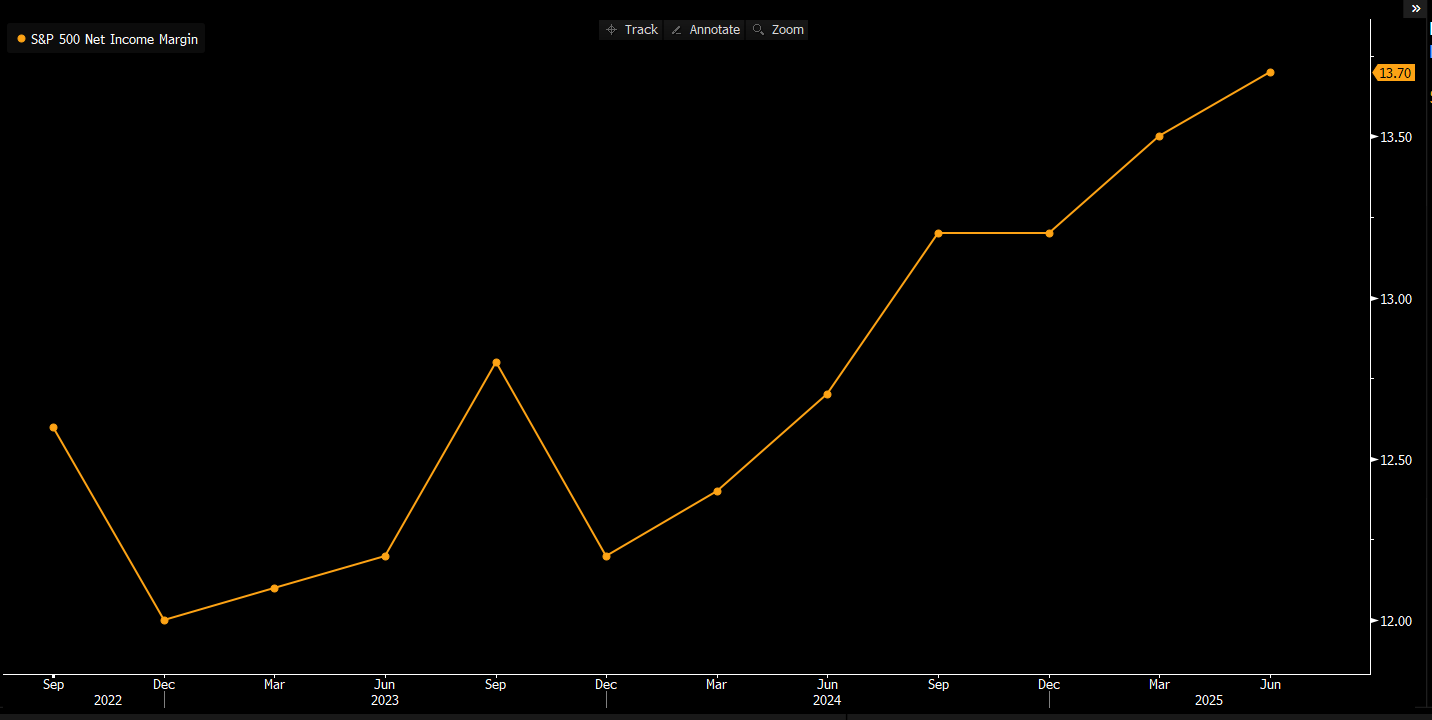
Strong earnings growth for businesses doesn’t hurt asset prices either. As we write this, 98% of companies within the S&P 500 have reported earnings for Q1. Astonishingly, profit growth continues to surpass forecasts and is on pace for a 7.77% gain, over double the estimate of 3.75%.4
Source: Bloomberg. Data estimates from 9/30/2022 to 6/30/2025.
Up and to the right. That’s what net profit margins are expected to look like after recovering from the COVID hangover. Should these estimates materialize, weak seasonality during the fall may not even be able to stop the train that is U.S. large cap stocks.
Nevertheless, it’s important to note that the largest stocks—mostly technology driven—have garnered and driven most of the earnings growth and profit margin expansion. For the stock market to hold its strength, the rest of the cohort needs to step up. The back half of this year will be our first glimpse into whether this will materialize.
- University of Michigan.
- EPB Research.
- Bureau of Labor Statistics.
- Bloomberg.
The S&P Global REIT Index measures the performance of publicly traded equity REITs listed in both developed and emerging markets. It is a member of the S&P Global Property Index Series.
The Bloomberg US Aggregate Bond TR Index measures the performance of investment grade, U.S. dollar-denominated, fixed-rate taxable bond market, including Treasuries, government-related and corporate securities, MBS (agency fixed-rate and hybrid ARM passthroughs), ABS, and CMBS.
The Bloomberg US Corporate High Yield Index measures the USD-denominated, high yield, fixed-rate corporate bond market. Securities are classified as high yield if the middle rating of Moody’s, Fitch and S&P is Ba1/BB+/BB+ or below.
The S&P 500 Index is widely regarded as the best single gauge of the U.S. equities market. The index includes a representative sample of 500 leading companies in leading industries of the U.S. economy. The S&P 500 Index focuses on the large-cap segment of the market; however, since it includes a significant portion of the total value of the market, it also represents the market.
The S&P 500 Equal Weighted Index is the equal-weight version of the widely-used S&P 500. The index includes the same constituents as the capitalization weighted S&P 500, but each company in the S&P 500 EWI is allocated a fixed weight – or 0.2% of the index total at each quarterly rebalance.
The Russell 2000 Index measures the performance of the small-cap segment of the US equity universe. It is a subset of the Russell 3000 and includes approximately 2000 of the smallest securities based on a combination of their market cap and current index membership. Russell Investment Group is the source and owner of the trademarks, service marks and copyrights related to the Russell Indexes. Russell® is a trademark of Russell Investment Group.
The MSCI EAFE Index measures the performance of the large and mid cap segments of developed markets, excluding the US & Canada equity securities. It is free float-adjusted market-capitalization weighted.
The MSCI Emerging Markets Index is a free float-adjusted market capitalization index that is designed to measure equity market performance in the global emerging markets.
This presentation is for educational and illustrative purposes only. It is not intended to offer or deliver investment advice in any way. Past performance is not indicative of future results. The information contained in this presentation has been gathered from sources we believe to be reliable, but we do not guarantee the accuracy or completeness of such information, and we assume no liability for damages resulting from or arising out of the use of such information. Any projections, market outlooks, or estimates are based upon certain assumptions and should not be construed as indicative of actual events that will occur. The performance numbers displayed herein may have been adversely or favorably impacted by events and economic conditions that will not prevail in the future. Any index presented does not incur management fees, transaction costs or other expenses associated with investable products. It is not possible to directly invest in an index.
Nova R Wealth, Inc. is a registered investment advisor with the U.S. Securities and Exchange Commission. SEC registration does not constitute an endorsement of the firm by the Commission, nor does it indicate that the adviser or investment adviser representative has attained a particular level of skill or ability. Nova R provides investment advisory and related services for clients nationally. This material is proprietary and may not be reproduced, transferred, or distributed in any form without prior written permission from Nova R Wealth, who reserves the right at any time and without notice to change, amend, or cease publication of the information contained herein.