

Summary
- Election years often stir up anxiety, and it’s natural to want to make a change based on who steps into the White House.
- Looking over short time frames, market returns during election months show no consistent trend based on which party wins the presidency. The data reveals that election-related volatility is more about short-term emotions than long-term fundamentals.
- Over the long term, political cycles have not significantly influenced stock market returns. What matters more are the economic conditions during each presidency, not the party in power.
- Successful investing focuses on staying the course and managing what you can control, rather than reacting to elections. Remaining invested allows you to capture the market’s long-term returns, regardless of political events.
As the U.S. election approaches, we have many clients asking: How will the results affect my portfolio? Should I move to cash and wait it out? These are common and understandable concerns. Election seasons can heighten anxiety, with both sides bombarding the public with constant stirring rhetoric. Given the high stakes, it's natural to wonder how the outcome could influence the stock market.
While we won’t take sides in this blog post, we will focus on what the data reveals and how we approach this recurring concern every four years. It’s worth noting that what may seem 'obvious' often isn’t—especially when the election outcome feels unpredictable.
Short-term Results
If you’ve ever watched CNBC or other market shows, you’ve probably noticed the commentators often talking over each other about how to structure an investment portfolio or what trade to make. Their differing opinions usually come down to one key factor: time horizon. So, when deciding whether to implement changes around an election, it’s important to look at both the short term and long term.
Looking at data for the U.S. stock market going back to 1926, returns in a month when presidential elections took place have not tended to be that different from returns in any other month. The chart below illustrates this point by showing the frequency of monthly returns (expressed in 1% increments) for a broad-market index of U.S. stocks. Each horizontal dash represents one month, and the blue and red horizontal lines represent months during which a presidential election was held, with red meaning a Republican won the White House and blue representing the same for Democrats.
Finding a clear pattern is tough, as election month returns have varied widely, with no obvious link to which party won the presidency.
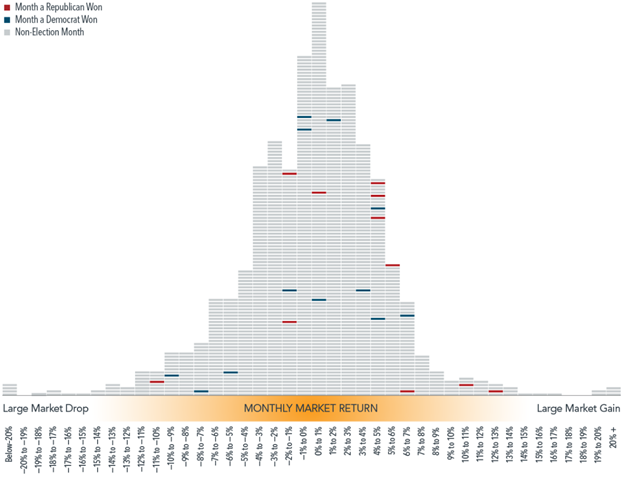
Source: Dimensional Fund Advisors. Distribution of monthly returns for the S&P 500 Index: January 1926-December 2023. The Fama/French Indices represent academic concepts that may be used in portfolio construction and are not available for direct investment or for use as a benchmark. In US dollars. Indices are not available for direct investment. Their performance does not reflect the expenses associated with the management of an actual portfolio. The tallest bar shows all months in which returns were between 0% and 1%. Dashes representing returns for a given month are stacked in ascending order of return within each column, with highest return within that range on top.
It’s fun to speculate about which president might be better for stocks, especially in the short run. Wall Street loves a good narrative. But history shows this is largely a futile exercise. At the end of the day, investors are buying shares in businesses that want to earn a profit, not political outcomes. Serving customers, building cool stuff, and making money will occur no matter who is in charge of the country. That’s what matters.
The Long View
Now that the short-term view is covered, a more intriguing question is whether the political party in power influences stock market performance over the full presidential term. Put simply, do political dynamics have a lasting impact on U.S. stock market returns in the long run?
To answer this question, we believe it’s worth revisiting a paper written by Lubos Pastor and Pietro Veronesi titled Political Cycles and Stock Returns.1 The authors found that from 1927 to 2015, excess returns for U.S. stocks under Democratic presidents were about 11% higher per year than it was under Republicans.
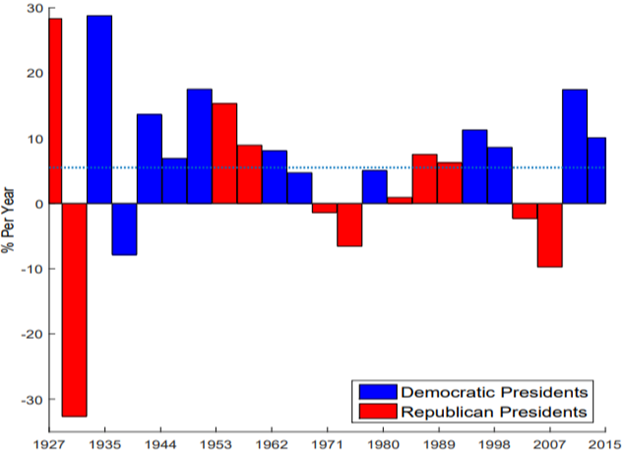
Source: “Political Cycles and Stock Returns” by Lubos Pastor and Pietro Veronesi. https://www.nber.org/papers/w23184. Average market returns under Democrat vs Republican presidents. This figure plots average U.S. excess stock market returns under each of the 23 administrations between 1927 and 2015, from President Coolidge through President Obama. The authors plot log returns on the value-weighted market index in excess of log returns on the three-month Treasury bill. Presidents are assumed to be in office until the end of the month during which they leave office. The horizontal dotted line plots the unconditional mean return.
Hold on. How can that be? I thought Republican presidents were pro-business and wanted less regulation and lower taxes. Shouldn’t that have translated to better stock market returns while they were in office?
All else being equal, you'd expect it to. So did the authors, and they set out to understand why that was not the case. A model they proposed and studied was based on risk aversion.
Their model suggests that when risk aversion is high—like during economic crises—voters are more likely to elect a Democratic president, seeking greater social insurance. Conversely, when risk aversion is low, voters tend to favor a Republican president, signaling a willingness to take on more business risk.
This makes intuitive sense, and perhaps it’s better to show with some specific examples:
- In 1932, the country was dealing with a Great Depression. Republican Herbert Hoover lost the election to Democrat Franklin D. Roosevelt.
- President John F. Kennedy was elected in 1960, during the 1960-1961 recession.
- President Jimmy Carter was elected in 1976, after the 1973-1975 recession.
- President Bill Clinton was elected in 1992, shortly after the 1990-1991 recession.
- In 2000, the tech bubble burst, and in 2008, the country experienced what became known as the Global Financial Crisis. President Obama won the election in November 2008.
Each of these elections took place when voters were likely more risk-averse than usual. When risk aversion is high, it tends to correlate with lower corporate earnings, higher unemployment, and depressed asset prices. This environment often leads to attractive forward returns and better excess returns. It’s no accident, then, that we see differences in excess returns between the two presidential parties, with market conditions playing a critical role.
Manage What’s Within Your Reach
Historically, presidential elections have had little impact on markets in the short run, and in the long run, it’s more about timing and the backdrop than the politics.
We believe this chart below provides one of the clearest examples of why trying to make investment decisions based on elections alone can be a poor strategy.
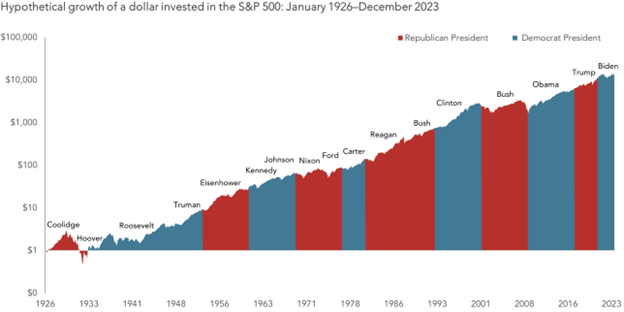
Source: Dimensional Fund Advisors. S&P data © 2024 S&P Dow Jones Indices LLC, a division of S&P Global. All rights reserved. Past performance is not a guarantee of future results. Indices are not available for direct investment; therefore, their performance does not reflect the expenses associated with the management of an actual portfolio.
To wrap it up—election years are emotional, and this one’s bound to be a real rollercoaster. But using politics as a market-timing tool just doesn’t work. If you want to capture the returns the market offers, you have to stay invested. As for policy and tax changes, we’re staying on top of any adjustments that might affect client portfolios or financial planning—and we’ll make sure to adapt as needed.
Please reach out if you have any questions or concerns.
- Snowberg, E., & Yariv, L. (2017). Political preferences and political institutions: Causal evidence of the effects of political institutions on political behavior (No. w23184). National Bureau of Economic Research. https://doi.org/10.3386/w23184
The S&P 500 Index is widely regarded as the best single gauge of the U.S. equities market. The index includes a representative sample of 500 leading companies in leading industries of the U.S. economy. The S&P 500 Index focuses on the large-cap segment of the market; however, since it includes a significant portion of the total value of the market, it also represents the market.
IMPORTANT DISCLAIMERS AND DISCLOSURES
This presentation is for educational and illustrative purposes only. It is not intended to offer or deliver investment advice in any way. Past performance is not indicative of future results. The information contained in this presentation has been gathered from sources we believe to be reliable, but we do not guarantee the accuracy or completeness of such information, and we assume no liability for damages resulting from or arising out of the use of such information. Any projections, market outlooks, or estimates are based upon certain assumptions and should not be construed as indicative of actual events that will occur. The performance numbers displayed herein may have been adversely or favorably impacted by events and economic conditions that will not prevail in the future. Any index presented does not incur management fees, transaction costs or other expenses associated with investable products. It is not possible to directly invest in an index.
Nova R Wealth, Inc. is a registered investment advisor with the U.S. Securities and Exchange Commission. SEC registration does not constitute an endorsement of the firm by the Commission, nor does it indicate that the adviser or investment adviser representative has attained a particular level of skill or ability. Nova R provides investment advisory and related services for clients nationally. This material is proprietary and may not be reproduced, transferred, or distributed in any form without prior written permission from Nova R Wealth, who reserves the right at any time and without notice to change, amend, or cease publication of the information contained herein.